


Why AI ROI Is Hard to Calculate
AI projects are approved on enthusiasm and evaluated on guesswork. A business case is built, projections are made, and then no one measures whether the projections were accurate.
The problem is not that AI lacks value. It is that AI value is hard to measure. Benefits are diffuse — faster processes, better decisions, fewer errors. Costs are ongoing — inference, monitoring, retraining. And outcomes are uncertain — AI systems sometimes work better than expected, sometimes worse.
This guide provides a practical AI ROI framework for Indian businesses in 2026. It covers the cost components, benefit categories, ROI formula, payback calculation, and worked examples with real numbers.
For organisations building AI systems with measurable value, Innovative AI Solutions provides AI consulting and AI development services.
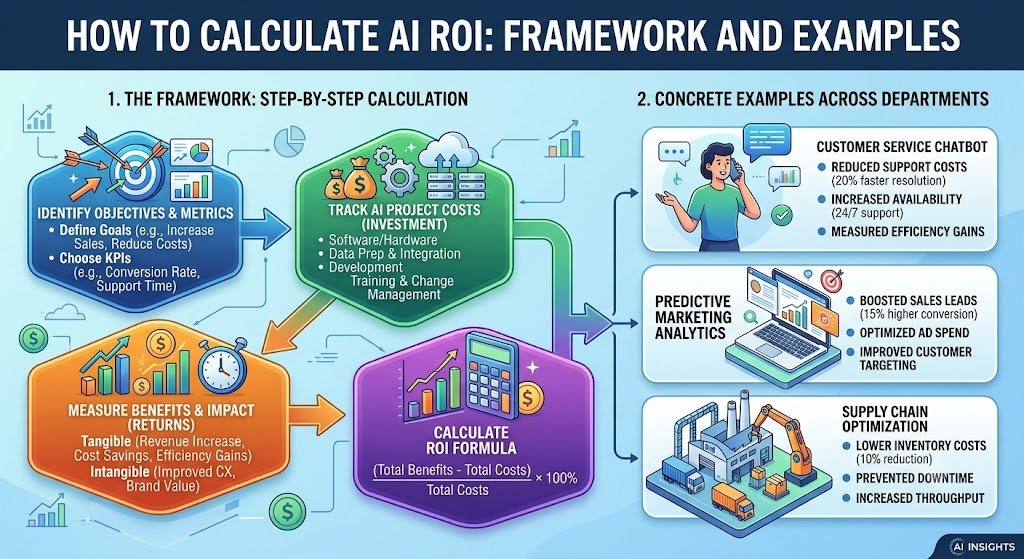
The AI ROI Framework
The Core Formula
text
AI ROI = (Total Benefits − Total Costs) ÷ Total Costs × 100
Where:
Total Benefits = quantified value over the measurement period
Total Costs = all costs over the same period (build + ongoing)
ROI = percentage return on investment
The Expanded Formula
text ROI = (Benefits − Build Cost − Ongoing Costs) ÷ (Build Cost + Ongoing Costs) × 100
Payback Period
text Payback Period = Build Cost ÷ (Monthly Benefits − Monthly Ongoing Costs) Payback period tells you how long until the AI investment pays for itself.
Net Present Value (NPV)
For longer-term investments, NPV accounts for the time value of money:
text NPV = Σ (Cash Flow_t ÷ (1 + r)^t) − Initial Investment Where r is the discount rate and t is the time period.
Cost Components
Build Costs (One-Time)
| Cost Category | Typical Range (INR) | Typical Range (USD) |
|---|---|---|
| Discovery and scoping | ₹1,00,000–₹5,00,000 | $1,200–$6,000 |
| Development | ₹3,00,000–₹25,00,000 | $3,600–$30,000 |
| AI model integration | ₹1,00,000–₹10,00,000 | $1,200–$12,000 |
| System integration | ₹1,00,000–₹8,00,000 | $1,200–$9,600 |
| Testing and QA | ₹50,000–₹3,00,000 | $600–$3,600 |
| Deployment | ₹25,000–₹2,00,000 | $300–$2,400 |
| Training | ₹25,000–₹1,50,000 | $300–$1,800 |
Ongoing Costs (Monthly)
| Cost Category | Typical Range (INR) | Typical Range (USD) |
|---|---|---|
| LLM API usage | ₹5,000–₹1,50,000 | $60–$1,800 |
| Infrastructure | ₹5,000–₹80,000 | $60–$960 |
| Vector database | ₹3,000–₹20,000 | $36–$240 |
| Monitoring | ₹5,000–₹30,000 | $60–$360 |
| Maintenance | ₹15,000–₹1,00,000 | $180–$1,200 |
| Human review | ₹20,000–₹2,00,000 | $240–$2,400 |
| Retraining | ₹25,000–₹1,00,000 | $300–$1,200 |
Total Cost of Ownership (3 Years)
text
3-Year TCO = Build Cost + (Monthly Ongoing Cost × 36)
Hidden Costs to Include
| Hidden Cost | Impact |
|---|---|
| Prompt iteration | Ongoing refinement |
| Evaluation datasets | Creation effort |
| Failure handling | Fallback systems |
| Exception handling | Human review |
| Governance | Compliance, audit |
| Model deprecation | Migration effort |
Benefit Categories
Benefit 1: Cost Reduction
| Source | How to Measure |
|---|---|
| Labour savings | Hours saved × hourly cost |
| Processing cost reduction | Cost per task reduction × volume |
| Error reduction | Error cost avoided |
| Infrastructure savings | Cloud cost reduction |
Benefit 2: Revenue Increase
| Source | How to Measure |
|---|---|
| Conversion improvement | Conversion lift × transaction value |
| Basket size increase | AOV lift × order volume |
| Retention improvement | Churn reduction × customer value |
| New capabilities | Revenue from new features |
Benefit 3: Time Savings
| Source | How to Measure |
|---|---|
| Faster processes | Time saved × value of time |
| Faster decisions | Decision time reduction × decision value |
| Faster onboarding | Ramp time reduction × new hire value |
Benefit 4: Quality Improvement
| Source | How to Measure |
|---|---|
| Fewer errors | Error rate reduction × cost per error |
| Better consistency | Consistency improvement value |
| Compliance improvement | Penalty avoidance |
Benefit 5: Risk Reduction
| Source | How to Measure |
|---|---|
| Fraud prevention | Losses avoided |
| Compliance risk | Penalty avoidance |
| Security incidents | Breach cost avoidance |
Worked Examples
Example 1: Customer Support Automation
Scenario: 10,000 support queries monthly, ₹50 manual cost per query.
| Item | Value |
|---|---|
| Build cost | ₹10,00,000 |
| Monthly ongoing cost | ₹2,48,000 |
| Deflection rate | 60% |
| Manual cost per query | ₹50 |
| Monthly manual cost | ₹5,00,000 |
| Monthly saving | ₹2,52,000 |
| Annual saving | ₹30,24,000 |
ROI Calculation:
| Metric | Value |
|---|---|
| Year 1 cost | ₹10,00,000 + (₹2,48,000 × 12) = ₹39,76,000 |
| Year 1 benefit | ₹5,00,000 × 12 = ₹60,00,000 |
| Year 1 ROI | (₹60,00,000 − ₹39,76,000) ÷ ₹39,76,000 × 100 = 50.9% |
| Payback period | ₹10,00,000 ÷ ₹2,52,000 = 4 months |
Example 2: Document Processing Automation
Scenario: 5,000 documents monthly, ₹80 manual cost per document.
| Item | Value |
|---|---|
| Build cost | ₹8,00,000 |
| Monthly ongoing cost | ₹1,50,000 |
| Automation rate | 80% |
| Manual cost per document | ₹80 |
| Monthly manual cost | ₹4,00,000 |
| Monthly saving | ₹2,50,000 |
| Annual saving | ₹30,00,000 |
ROI Calculation:
| Metric | Value |
|---|---|
| Year 1 cost | ₹8,00,000 + (₹1,50,000 × 12) = ₹26,00,000 |
| Year 1 benefit | ₹4,00,000 × 12 = ₹48,00,000 |
| Year 1 ROI | (₹48,00,000 − ₹26,00,000) ÷ ₹26,00,000 × 100 = 84.6% |
| Payback period | ₹8,00,000 ÷ ₹2,50,000 = 3.2 months |
Example 3: Sales Lead Qualification
Scenario: 5,000 leads monthly, 20% conversion improvement.
| Item | Value |
|---|---|
| Build cost | ₹12,00,000 |
| Monthly ongoing cost | ₹2,00,000 |
| Conversion improvement | 20% |
| Average deal value | ₹50,000 |
| Baseline conversions | 100/month |
| Additional conversions | 20/month |
| Monthly additional revenue | ₹10,00,000 |
| Gross margin | 40% |
| Monthly gross profit | ₹4,00,000 |
ROI Calculation:
| Metric | Value |
|---|---|
| Year 1 cost | ₹12,00,000 + (₹2,00,000 × 12) = ₹36,00,000 |
| Year 1 gross profit | ₹4,00,000 × 12 = ₹48,00,000 |
| Year 1 ROI | (₹48,00,000 − ₹36,00,000) ÷ ₹36,00,000 × 100 = 33.3% |
| Payback period | ₹12,00,000 ÷ ₹2,00,000 = 6 months |
Example 4: Predictive Maintenance
Scenario: Manufacturing plant with ₹50,00,000 annual unplanned downtime cost.
| Item | Value |
|---|---|
| Build cost | ₹25,00,000 |
| Monthly ongoing cost | ₹4,00,000 |
| Downtime reduction | 40% |
| Annual downtime cost | ₹50,00,000 |
| Annual saving | ₹20,00,000 |
ROI Calculation:
| Metric | Value |
|---|---|
| Year 1 cost | ₹25,00,000 + (₹4,00,000 × 12) = ₹73,00,000 |
| Year 1 benefit | ₹20,00,000 |
| Year 1 ROI | Negative |
| Year 2 cost | ₹48,00,000 |
| Year 2 benefit | ₹20,00,000 |
| Year 2 ROI | Negative |
| 3-Year ROI | Still negative at this saving level |
Analysis: Predictive maintenance has high build cost and ongoing cost. It requires larger downtime savings or longer time horizon to show positive ROI.
Example Summary
| Use Case | Year 1 ROI | Payback |
|---|---|---|
| Customer support | 50.9% | 4 months |
| Document processing | 84.6% | 3.2 months |
| Lead qualification | 33.3% | 6 months |
| Predictive maintenance | Negative | 3+ years |
Measuring AI ROI in Practice
Step 1: Define the Baseline
| Activity | Purpose |
|---|---|
| Measure current cost | Baseline for comparison |
| Measure current performance | Metrics to improve |
| Document process | How work is done today |
Step 2: Define Success Metrics
| Metric Type | Examples |
|---|---|
| Cost metrics | Cost per task, cost per resolution |
| Revenue metrics | Conversion, AOV, retention |
| Time metrics | Processing time, response time |
| Quality metrics | Error rate, accuracy |
Step 3: Measure Post-Implementation
| Activity | Purpose |
|---|---|
| Measure new cost | Compare to baseline |
| Measure new performance | Compare to baseline |
| Calculate delta | Quantify improvement |
Step 4: Calculate ROI
| Activity | Purpose |
|---|---|
| Sum benefits | All quantified improvements |
| Sum costs | Build + ongoing |
| Apply formula | Calculate ROI |
| Calculate payback | Time to break even |
Step 5: Monitor and Adjust
| Activity | Frequency |
|---|---|
| Track actual costs | Monthly |
| Track actual benefits | Monthly |
| Recalculate ROI | Quarterly |
| Adjust projections | As data accumulates |
Common AI ROI Mistakes
Mistake 1: Counting Engagement as Value
Conversations, interactions, and engagement are not value. Resolution, deflection, and cost reduction are value.
Mistake 2: Ignoring Ongoing Costs
AI systems have significant ongoing costs — inference, monitoring, retraining. Ignoring these inflates ROI.
Mistake 3: Overestimating Deflection
Deflection rates vary by query type. Assuming 80% deflection across all queries leads to disappointed results.
Mistake 4: Underestimating Implementation Time
AI projects take longer than expected. Extended timelines delay benefits and reduce ROI.
Mistake 5: Not Measuring
Most businesses never measure whether AI delivered the projected value. Without measurement, ROI is guesswork.
Mistake 6: Ignoring Hidden Costs
Prompt iteration, exception handling, governance, and model deprecation all add cost. Ignoring them overstates ROI.
India-Specific Considerations
Indian Cost Context
| Factor | Implication |
|---|---|
| Lower labour costs | Lower manual cost baseline |
| Lower development costs | Lower build costs |
| Cloud costs | Competitive |
| Talent costs | Growing |
Lower labour costs mean AI savings must be larger in percentage terms to justify investment — but lower development costs make the investment smaller.
Indian ROI Benchmarks
| Use Case | Typical Payback |
|---|---|
| Customer support | 3–6 months |
| Document processing | 3–6 months |
| Lead qualification | 6–12 months |
| Predictive maintenance | 18–36 months |
| AI SaaS product | 12–36 months |
Compliance Costs
| Requirement | Impact on ROI |
|---|---|
| DPDPA compliance | Additional cost |
| AI governance | Additional cost |
| Audit trails | Additional logging cost |
Decision Framework: AI ROI Readiness
Readiness Scorecard
| Criteria | Weight | Score (1–5) | Weighted Score |
|---|---|---|---|
| Baseline measured | 20% | ||
| Benefits quantifiable | 20% | ||
| Costs identified | 20% | ||
| Success metrics defined | 15% | ||
| Measurement process | 15% | ||
| Executive support | 10% | ||
| Total | 100% | /5 |
Use Case ROI Matrix
| Use Case | Build Cost | Ongoing Cost | Benefit Type | Payback |
|---|---|---|---|---|
| Customer support | Moderate | Moderate | Cost reduction | 3–6 months |
| Document processing | Moderate | Moderate | Cost reduction | 3–6 months |
| Lead qualification | Moderate-High | Moderate | Revenue increase | 6–12 months |
| Recommendations | Moderate | Low-Moderate | Revenue increase | 6–12 months |
| Predictive maintenance | High | High | Cost avoidance | 18–36 months |
Implementation Roadmap
| Phase | What to Do | Timeline |
|---|---|---|
| Phase 1 | Baseline measurement | 2–4 weeks |
| Phase 2 | Metric definition | 1–2 weeks |
| Phase 3 | Implementation | As per project |
| Phase 4 | Post-implementation measurement | 4–8 weeks |
| Phase 5 | ROI calculation and monitoring | Ongoing |
Frequently Asked Questions
1. How do I calculate AI ROI?
AI ROI = (Total Benefits − Total Costs) ÷ Total Costs × 100. Total benefits are quantified improvements. Total costs include build and ongoing costs.
2. What costs should I include in AI ROI?
Build costs (development, integration, testing, training) and ongoing costs (inference, infrastructure, monitoring, maintenance, retraining, human review).
3. What benefits should I include?
Cost reduction (labour, processing, errors), revenue increase (conversion, AOV, retention), time savings, quality improvement, and risk reduction.
4. What is a good AI ROI?
It depends on the use case. Customer support and document processing typically achieve 50–85% year 1 ROI with 3–6 month payback. Predictive maintenance has longer payback.
5. How do I measure deflection rate?
Deflection rate = (Queries resolved by AI ÷ Total queries) × 100. It is the key metric for support automation ROI.
6. How do I measure AI benefits?
Define baseline metrics before implementation. Measure the same metrics after implementation. The delta is the benefit.
7. What is the payback period for AI projects?
Customer support and document processing: 3–6 months. Lead qualification: 6–12 months. Predictive maintenance: 18–36 months.
8. Why do most AI ROI calculations fail?
Counting engagement instead of value, ignoring ongoing costs, overestimating deflection, underestimating implementation time, not measuring actual results, and ignoring hidden costs.
9. How does DPDPA affect AI ROI?
DPDPA compliance adds cost (consent management, audit trails, security). This reduces ROI but is mandatory.
10. Should I include AI governance costs in ROI?
Yes. Governance costs are real and ongoing. Including them gives an accurate ROI picture.
11. How often should I recalculate AI ROI?
Quarterly. Track actual costs and benefits monthly, recalculate ROI quarterly, and adjust projections as data accumulates.
12. How can Innovative AI Solutions help?
Innovative AI Solutions is a Delhi-based AI development company that helps businesses build AI systems with measurable value. We define baselines, implement systems, and measure ROI — with transparent costs and DPDPA compliance. Explore our AI consulting and AI development services.
Contact Innovative AI Solutions
Ready to calculate and improve your AI ROI?
We help Indian businesses define AI ROI, measure results, and build systems that deliver measurable value.
Contact Information
Innovative AI Solutions
📍 Netaji Subhash Place, Pitampura, Delhi – 110034
🌐 Website: https://innovativeais.com 📧 Email: info@innovativeais.com
📞 Phone: +91 7464 099 059 / +91 96899 67356
Business Services
• AI Automation • AI Development • AI Consulting • Machine Learning Solutions • Deep Learning Solutions • Generative AI Services • NLP Solutions • AI Agents • AI Chatbots • Voice AI • CRM Development • Custom Software Development • Website Development • Mobile App Development
About the Author
Abhishek Kumar
Founder & CEO, Innovative AI Solutions
5+ years building production AI systems for Indian businesses. Based in Delhi, serving clients across India.
Ready to build AI solutions for your business?
Innovative AI Solutions — Delhi's leading AI development company. Free consultation available.
Get Free Consultation →
A practical 2026 framework for calculating AI ROI — cost components, benefit categories, worked examples, and benchmarks for Indian businesses.
#AIROI #Framework #Examples #2026 #Calculation #CostComponents #Benefits #PaybackPeriod #TCO #BusinessCase #Investment #Measurement #India #DelhiNCRTech #EnterpriseApps #StartupApps #AIAdoption #BusinessAI #TechIndia #DigitalProducts #AIStrategy #CostBenefit #FinancialAnalysis #AIValue #InnovativeAISolutions
Copyright © 2015–2026 Innovative AI Solutions. All Rights Reserved. | Privacy Policy | Terms & Conditions