


The Dashboard That Nobody Opens
An Indian business invests in a custom admin dashboard. The design is polished. The charts are colourful. Every metric the team could think of is on the screen: revenue, orders, users, page views, conversion rate, average order value, support tickets, inventory levels, and a dozen more. The dashboard launches to great enthusiasm. Two months later, the analytics team checks the usage logs. The dashboard is opened by three people, once a week, and most of the time is spent scrolling to find the one number they actually need.
The dashboard failed—not because it was badly built, but because it was designed as a data display rather than a decision tool. It answered "what is happening?" but not "what should I do?" It showed everything and prioritised nothing.
This is the most common failure in custom admin dashboard development. The technology is not the hard part. Modern frameworks make it easy to build charts. The hard part is deciding what the dashboard is for, who it is for, and what decision it should drive. A dashboard that does not change behaviour is a dashboard that does not earn its cost.
For Indian businesses, this matters because data is abundant and attention is scarce. Operations teams, sales leaders, finance controllers, and founders all need different views of the business. A single dashboard that tries to serve everyone serves no one. Custom dashboard development is the discipline of building the right views for the right people, with the right data, at the right speed.
India adds specific considerations. DPDPA applies to dashboards that display personal data, requiring role-based access and audit logging. MeitY AI governance applies if the dashboard includes AI-generated insights. Data localisation may require the dashboard's data warehouse to be in India for regulated sectors. And performance matters because Indian users access dashboards on varied devices and networks, and a slow dashboard is an unused dashboard.
This guide is written for Indian business leaders, operations heads, and engineering managers evaluating custom dashboard development. We will cover the KPI selection framework, the dashboard architecture, the performance considerations, real costs in rupees and dollars, DPDPA compliance, and a phased implementation framework with clear go/no-go gates.
What a Dashboard Actually Is (And What It Is Not)
The Definition
A dashboard is a visual interface that presents the most important metrics for a specific audience to support a specific decision. The key words are specific audience and specific decision. A dashboard without a defined audience and decision is a data display, not a dashboard.
What a Dashboard Is Not
It is not a data warehouse. A dashboard displays data; it does not store it. The data warehouse is the source.
It is not a report. Reports are detailed and static. Dashboards are summarised and interactive.
It is not a BI tool. BI tools allow ad-hoc exploration. Dashboards are designed for specific, recurring questions.
It is not a data dump. Showing every metric is not a dashboard. It is a table with charts.
The Dashboard vs Report vs BI Tool Table
| Artefact | Purpose | Audience | Interaction |
|---|---|---|---|
| Report | Detailed record | Analysts, auditors | Static |
| Dashboard | Decision support | Specific roles | Interactive |
| BI tool | Exploration | Analysts | Ad-hoc |
| Data warehouse | Storage | Engineers | None |
For teams building the dashboard and the data pipelines behind it, our Custom Software Development and AI Development practices cover the full stack.
KPI Selection: The Foundation of a Useful Dashboard
The most important decision in dashboard development is not the technology. It is which metrics to show.
The KPI Selection Framework
A good KPI has five characteristics:
1. Actionable. It drives a decision. If the metric changes, someone does something differently.
2. Relevant. It is tied to a business goal.
3. Timely. It is measured at a frequency that allows action.
4. Comparable. It can be compared over time or across segments.
5. Understandable. The audience knows what it means.
The Dashboard by Role
Different roles need different KPIs:
| Role | Key Questions | Typical KPIs |
|---|---|---|
| Founder/CEO | Is the business healthy? | Revenue, growth, runway, churn |
| Sales leader | Is the pipeline healthy? | Leads, conversion, deal size, cycle time |
| Operations | Are we delivering? | Order volume, fulfilment time, errors |
| Finance | Are we profitable? | Revenue, costs, margin, receivables |
| Support | Are customers happy? | Ticket volume, resolution time, CSAT |
The design principle: Build separate dashboards for separate roles. A founder does not need the same view as an operations manager. A dashboard that tries to serve both shows too much for both.
The Three Levels of Dashboards
1. Strategic dashboards. For executives. Weekly or monthly cadence. High-level KPIs, trends, comparisons.
2. Operational dashboards. For managers. Daily cadence. Operational metrics, exceptions, drill-downs.
3. Analytical dashboards. For analysts. Ad-hoc. Detailed data, exploration, segmentation.
The KPI Selection Table
| Level | Audience | Cadence | Example KPI |
|---|---|---|---|
| Strategic | Executives | Weekly/monthly | Revenue growth |
| Operational | Managers | Daily | Fulfilment time |
| Analytical | Analysts | Ad-hoc | Segment conversion |
Dashboard Architecture: From Data Source to Screen
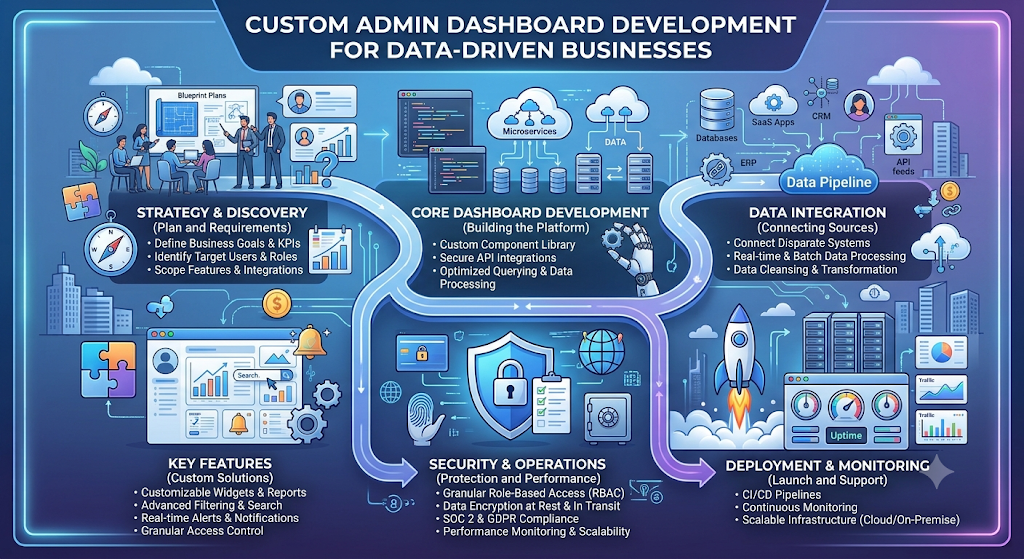
A dashboard is the visible layer of a data pipeline. The architecture determines whether the dashboard is fast, accurate, and maintainable.
The Components
1. Data sources. The systems where data originates: databases, CRM, ERP, APIs, logs.
2. ETL/ELT. The process that extracts, transforms, and loads data from sources into the warehouse.
3. Data warehouse. The central store where data is modelled for analysis. Options: PostgreSQL, BigQuery, Snowflake, Redshift.
4. Semantic layer. The definition of metrics (revenue, churn, conversion) so that everyone uses the same definition.
5. Dashboard backend. The API that serves data to the dashboard. Handles queries, caching, and aggregation.
6. Dashboard frontend. The UI that displays charts, tables, and filters.
The Architecture at a Glance
| Layer | Component | India Consideration |
|---|---|---|
| Sources | Databases, CRM, ERP | Data localisation |
| ETL | Airbyte, Fivetran, custom | Scheduling |
| Warehouse | PostgreSQL, BigQuery | Indian region |
| Semantic | Metric definitions | Consistency |
| Backend | API, caching | Performance |
| Frontend | React, Vue | Device variety |
The Semantic Layer
The semantic layer is the most underrated component. It defines what "revenue" means, what "active user" means, and what "churn" means. Without it, different dashboards show different numbers for the same metric, and trust collapses.
The implementation: Define metrics in code (dbt, LookML) or in a configuration file. The dashboard backend reads from the semantic layer, so every chart uses the same definition.
Caching for Performance
Dashboards are read-heavy. The same queries run repeatedly. Caching is essential:
Query cache: cache the results of expensive queries.
Materialised views: pre-compute aggregations.
Incremental refresh: update only changed data.
Performance: The Difference Between Used and Unused
A dashboard that takes 30 seconds to load is a dashboard that nobody uses. Performance is a feature.
The Performance Levers
1. Pre-aggregation. Compute aggregations ahead of time (hourly, daily) rather than on every request.
2. Materialised views. Store the results of expensive queries.
3. Query optimisation. Index the columns used in filters and joins.
4. Pagination. Load data in pages, not all at once.
5. Lazy loading. Load charts as the user scrolls.
6. Caching. Cache results at the API layer.
7. Data limits. Limit the time range and row count.
The Performance Targets
| Metric | Target | Why |
|---|---|---|
| Initial load | < 3 seconds | User patience |
| Filter response | < 1 second | Interactivity |
| Chart render | < 500ms | Smooth experience |
| Data freshness | Depends on use case | Operational vs strategic |
The India Context
Indian users access dashboards on varied devices and networks. A dashboard that loads in 2 seconds on a fast connection may take 10 seconds on a 3G connection. Design for the slowest connection:
Compress data before sending.
Use server-side rendering for the initial view.
Minimise JavaScript on the critical path.
Test on real devices, not just desktop.
Real Costs in India (2026)
Custom dashboard development costs depend on the number of dashboards, the complexity of the data pipeline, and the level of interactivity.
Build Costs
| Scope | Build Cost (₹) | Build Cost ($ approx.) | Timeline |
|---|---|---|---|
| Single dashboard (one data source, static charts) | ₹2–5 lakh | $2,400–$6,000 | 4–8 weeks |
| Multi-dashboard (multiple roles, 2–3 sources) | ₹5–15 lakh | $6,000–$18,000 | 8–16 weeks |
| Full analytics platform (warehouse, semantic layer, multiple dashboards) | ₹15–40 lakh | $18,000–$48,000 | 16–28 weeks |
| Enterprise BI platform (real-time, AI insights, multi-tenant) | ₹40–90 lakh | $48,000–$1,08,000 | 24–36 weeks |
Note: USD conversions at ₹83/$. Ranges are indicative for Indian development teams.
Running Costs
| Component | Monthly Cost (₹) | Monthly Cost ($ approx.) | Notes |
|---|---|---|---|
| Hosting | ₹10,000–₹50,000 | $120–$600 | Cloud infrastructure |
| Data warehouse | ₹10,000–₹80,000 | $120–$960 | Depends on data volume |
| ETL | ₹5,000–₹30,000 | $60–$360 | Managed or self-hosted |
| Maintenance | ₹15,000–₹60,000 | $180–$720 | 15–25% of build annually |
The ROI Case
A dashboard that saves a manager 30 minutes per day is worth roughly ₹15,000 per month at ₹500/hour. For a team of ten managers, that is ₹1.5 lakh per month, or ₹18 lakh per year. The dashboard pays for itself if it costs less than this and actually changes decisions.
India-Specific Compliance: DPDPA and Data Localisation
DPDPA and Dashboards
Dashboards display personal data: customer names, employee performance, individual transactions. Under the DPDP Act:
Role-based access: users should only see data they are authorised to see.
Data minimisation: show only the data needed for the decision.
Audit logging: log who accessed what dashboard.
Retention: define retention for dashboard data.
Data Localisation
For regulated sectors, the data warehouse and dashboard may need to be in India. Choose Indian cloud regions (AWS Mumbai, Azure Pune, GCP Mumbai).
MeitY AI Governance
If the dashboard includes AI-generated insights (anomaly detection, recommendations):
Transparency: label AI-generated insights.
Accountability: a named owner for AI insights.
Human oversight: decisions based on AI insights should be reviewable.
The Compliance Checklist
| Requirement | Implementation | Priority |
|---|---|---|
| Role-based access | RBAC for dashboards | High |
| Data minimisation | Only needed metrics | Medium |
| Audit logging | Log access and queries | High |
| Data localisation | Indian region | Medium (regulated) |
| AI transparency | Label AI insights | Medium |
Implementation Framework: A Phased Approach With Cost Gates
Phase 1: KPI Definition (Week 1–2)
Objective: Define the audience, decisions, and KPIs.
Activities:
Identify the roles that will use the dashboard.
Identify the decisions each role makes.
Define the KPIs for each role.
Define the cadence and data freshness requirements.
Define the data sources.
Cost: ₹50,000–₹1.5 lakh ($600–$1,800).
Go/No-Go: KPIs defined. Roles defined. Sources identified.
Phase 2: Data Pipeline (Week 3–10)
Objective: Build the data pipeline from sources to warehouse.
Activities:
Set up ETL from sources.
Build the data warehouse.
Define the semantic layer.
Validate data quality.
Cost: ₹3–10 lakh ($3,600–$12,000).
Go/No-Go: Data flows correctly. Metrics defined.
Phase 3: Dashboard Build (Week 11–20)
Objective: Build the dashboards.
Activities:
Build the dashboard frontend.
Build the dashboard backend API.
Implement caching.
Implement role-based access.
Test with real users.
Cost: ₹5–15 lakh ($6,000–$18,000).
Go/No-Go: Dashboards load fast. Users find them useful.
Phase 4: Optimization and Scale (Ongoing)
Objective: Optimize performance and expand.
Activities:
Optimize slow queries.
Add new dashboards.
Add AI insights (if needed).
Monitor usage.
Cost: ₹15,000–₹60,000/month ($180–$720).
Phase Summary Table
| Phase | Duration | Key Deliverable | Cost (₹) | Go/No-Go Criteria |
|---|---|---|---|---|
| 1. KPI Definition | 2 weeks | KPIs, roles | 50,000–1.5 lakh | Defined |
| 2. Data Pipeline | 8 weeks | ETL, warehouse | 3–10 lakh | Data flows |
| 3. Dashboard Build | 10 weeks | Dashboards, access | 5–15 lakh | Fast, useful |
| 4. Optimization | Ongoing | Performance | 15,000–60,000/month | Improving |
Risks, Pitfalls, and Governance
The Most Common Dashboard Failures
Showing everything. Too many metrics, no prioritisation. Mitigation: KPI selection, one decision per dashboard.
No semantic layer. Different dashboards show different numbers. Mitigation: Metric definitions.
Slow performance. The dashboard takes too long to load. Mitigation: Caching, pre-aggregation.
No role-based access. Everyone sees everything. Mitigation: RBAC.
No user involvement. The dashboard is built without the users. Mitigation: Co-design with users.
No usage tracking. Nobody knows if the dashboard is used. Mitigation: Usage analytics.
Risk Summary Table
| Risk | Likelihood | Impact | Mitigation |
|---|---|---|---|
| Showing everything | High | High (unused) | KPI selection |
| No semantic layer | High | High (trust) | Definitions |
| Slow performance | High | High (unused) | Caching |
| No RBAC | Medium | Critical (DPDPA) | Role-based access |
| No user involvement | High | High | Co-design |
| No usage tracking | High | Medium | Usage analytics |
Benchmark Summary and Decision Framework
Decision Matrix: Build vs Buy
| Your Situation | Recommended Path |
|---|---|
| Standard metrics, fast | BI tool (Metabase, Power BI) |
| Unique workflow, custom UI | Build custom |
| Embedded in product | Build custom |
| Internal only, standard | Buy BI tool |
Dashboard Priority Table
| Priority | Capability | Why |
|---|---|---|
| 1 | KPI definition | Foundation |
| 2 | Data pipeline | Accuracy |
| 3 | Performance | Adoption |
| 4 | Role-based access | Compliance |
| 5 | Usage tracking | Improvement |
The One-Paragraph Decision Rule
If you are building a dashboard, start with the decision, not the data. Define the audience and the decision each dashboard supports. Select only the KPIs that drive that decision. Build the data pipeline before the dashboard. Cache and pre-aggregate for performance. Implement role-based access. And track usage—if nobody opens it, it is not a dashboard.
Frequently Asked Questions
1. How much does custom admin dashboard development cost in India?
A single dashboard costs ₹2–5 lakh ($2,400–$6,000). Multi-dashboard costs ₹5–15 lakh ($6,000–$18,000). A full analytics platform costs ₹15–40 lakh ($18,000–$48,000). Enterprise BI costs ₹40–90 lakh ($48,000–$1,08,000).
2. Should I build a custom dashboard or use a BI tool?
Use a BI tool (Metabase, Power BI) for standard metrics and internal use. Build custom for unique workflows, embedded dashboards, or when you need full control over the UI.
3. What is a KPI and how do I choose one?
A KPI is a metric tied to a business goal. Choose KPIs that are actionable, relevant, timely, comparable, and understandable. Each dashboard should support one decision.
4. What is the semantic layer?
The semantic layer defines metrics (revenue, churn) so that every dashboard uses the same definition. Without it, different dashboards show different numbers.
5. How do I make my dashboard fast?
Pre-aggregate data, use materialised views, cache query results, paginate data, and lazy load charts. Test on real devices and slow connections.
6. How does DPDPA affect dashboards?
Dashboards that display personal data need role-based access, data minimisation, audit logging, and retention policies.
7. What is role-based access in a dashboard?
Different users see different data based on their role. A sales rep sees their deals; a sales manager sees the team's deals; the CEO sees everything.
8. How do I know if my dashboard is useful?
Track usage: who opens it, how often, and what they do after. If nobody uses it, it is not useful.
9. How long does dashboard development take?
A single dashboard takes 4–8 weeks. Multi-dashboard takes 8–16 weeks. A full analytics platform takes 16–28 weeks.
10. What is the difference between a dashboard and a report?
A report is a detailed, static record. A dashboard is a summarised, interactive view for decision support.
11. Can I add AI insights to my dashboard?
Yes. Anomaly detection, forecasts, and recommendations can be added. But they should be labelled as AI-generated and reviewable.
12. How can Innovative AI Solutions help?
Innovative AI Solutions builds custom admin dashboards for Indian businesses—KPI definition, data pipelines, semantic layers, role-based access, and DPDPA-compliant implementation. Our Delhi-based team handles design, development, and optimization. Visit https://innovativeais.com to discuss your requirements.
Contact Innovative AI Solutions
Ready to build a dashboard that actually drives decisions?
[One-line supporting sentence.]
Contact Information
Innovative AI Solutions
📍 Netaji Subhash Place, Pitampura, Delhi – 110034
🌐 Website: https://innovativeaislabs.com 📧 Email: info@innovativeais.com
📞 Phone: +91 7464 099 059 / +91 96899 67356
Business Services
AI Automation
AI Development
AI Consulting
Machine Learning Solutions
Deep Learning Solutions
Generative AI Services
NLP Solutions
AI Agents
AI Chatbots
Voice AI
CRM Development
Custom Software Development
Website Development
Mobile App Development
About the Author
Abhishek Kumar
Founder & CEO, Innovative AI Solutions
5+ years building production AI systems for Indian businesses. Based in Delhi, serving clients across India.
Ready to build AI solutions for your business?
Innovative AI Solutions — Delhi's leading AI development company. Free consultation available.
Get Free Consultation →
A practical 2026 guide for Indian businesses building custom admin dashboards—KPI selection, data pipelines, semantic layers, performance, real rupee costs, and DPDPA-compliant role-based access.
#AdminDashboard #DashboardDevelopment #KPIDashboard #BusinessDashboard #AnalyticsDashboard #AdminPanel #RealTimeDashboard #DashboardArchitecture #DataVisualization #RoleBasedAccess #DPDPA #MeitY #BITools #DashboardPerformance #DataPipeline #DelhiNCR #InnovativeAISolutions
Copyright ©️ 2015–2026 Innovative AI Solutions. All Rights Reserved. | Privacy Policy | Terms & Conditions