


Why Forecasting Matters More Than Ever
Every business forecasts. How much will we sell next month? How much inventory do we need? How many staff should we schedule? How much cash will we have?
Most businesses forecast badly. They use spreadsheets, gut feel, and last year's numbers. They overstock some items and stock out on others. They miss demand spikes and carry excess inventory through slow periods.
The cost is significant. Excess inventory ties up working capital and risks obsolescence. Stockouts lose sales and damage customer relationships. Both are avoidable with better forecasting.
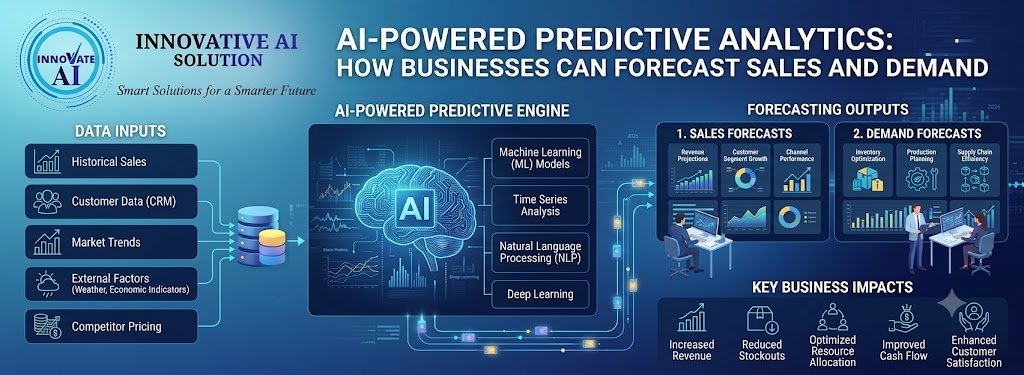
AI-powered predictive analytics changes what is possible. Machine learning models process historical data, weather, festivals, promotions, and external signals to produce forecasts that are significantly more accurate than traditional methods.
This guide explains how AI-powered predictive analytics works for sales and demand forecasting in 2026. It covers models, data requirements, accuracy, costs in India, and implementation.
For organisations building forecasting systems, Innovative AI Solutions provides machine learning solutions and AI development services.
What AI Forecasting Actually Does
The Definition
AI forecasting uses machine learning to predict future sales or demand based on historical patterns and external signals.
| Traditional Forecasting | AI Forecasting |
|---|---|
| Spreadsheets | Machine learning models |
| Simple averages | Pattern recognition |
| Manual adjustments | Automated signals |
| Slow updates | Continuous learning |
| Limited accuracy | Higher accuracy |
What It Predicts
| Prediction Type | Use Case |
|---|---|
| Sales forecast | Revenue planning |
| Demand forecast | Inventory planning |
| SKU-level demand | Stock allocation |
| Store-level demand | Local inventory |
| Category demand | Category management |
| Seasonal demand | Seasonal planning |
The Business Impact
| Metric | Improvement |
|---|---|
| Forecast accuracy | 20–40% improvement |
| Inventory reduction | 15–30% |
| Stockout reduction | 30–50% |
| Wastage reduction | 30–70% (perishables) |
| Working capital | 10–25% freed |
The Forecasting Models
Model Type 1: Time Series
Traditional statistical models for time-based data.
| Model | Best For |
|---|---|
| ARIMA | Stationary time series |
| Prophet | Seasonal data with holidays |
| Exponential smoothing | Trend and seasonality |
Model Type 2: Gradient Boosting
Machine learning models that handle complex feature interactions.
| Model | Best For |
|---|---|
| XGBoost | Tabular data, feature-rich |
| LightGBM | Large datasets, fast training |
| CatBoost | Categorical features |
Model Type 3: Deep Learning
Neural networks for complex sequential patterns.
| Model | Best For |
|---|---|
| LSTM | Long sequences |
| Transformer | Complex patterns |
| N-BEATS | Time series forecasting |
Model Type 4: Ensemble
Combining multiple models for better accuracy.
| Approach | Benefit |
|---|---|
| Averaging | Reduces variance |
| Stacking | Combines strengths |
| Weighted ensemble | Optimises contribution |
Model Selection Guide
| Your Situation | Recommended Model |
|---|---|
| Simple seasonal data | Prophet |
| Feature-rich tabular | XGBoost or LightGBM |
| Complex patterns | LSTM or Transformer |
| Best accuracy | Ensemble |
Data Requirements
The Data You Need
| Data Type | Purpose |
|---|---|
| Historical sales | Pattern learning |
| SKU data | Product characteristics |
| Store data | Location patterns |
| Price data | Price elasticity |
| Promotion data | Promotion impact |
| Weather data | Weather sensitivity |
| Festival calendar | Seasonal spikes |
| External signals | Market trends |
Minimum Data Requirements
| Requirement | Minimum |
|---|---|
| History | 1–2 years |
| Granularity | SKU × store × day |
| Volume | 10,000+ records |
| Quality | Clean, consistent |
Feature Engineering
| Feature Type | Examples |
|---|---|
| Lag features | Sales last week, last month |
| Rolling averages | 7-day, 30-day averages |
| Seasonality | Day of week, month |
| Weather | Temperature, rainfall |
| Events | Festivals, holidays |
| Promotions | Discounts, campaigns |
India-Specific Data Considerations
| Factor | Implication |
|---|---|
| Festival calendar | Major demand spikes |
| Weather patterns | Monsoon, summer |
| Regional variation | Different preferences |
| Price sensitivity | High in mass market |
Building the Forecasting System
Step 1: Data Collection (Weeks 1–4)
| Activity | Purpose |
|---|---|
| Collect historical sales | Training data |
| Integrate external data | Weather, festivals |
| Clean data | Quality |
| Structure data | Ready for modelling |
Step 2: Exploratory Analysis (Weeks 4–6)
| Activity | Purpose |
|---|---|
| Understand patterns | Seasonal, trend |
| Identify anomalies | Outliers |
| Assess data quality | Gaps, issues |
| Define features | What to include |
Step 3: Model Development (Weeks 6–12)
| Activity | Purpose |
|---|---|
| Build baseline | Simple model first |
| Train ML models | Improve accuracy |
| Validate | Test on holdout |
| Iterate | Improve |
Step 4: Integration (Weeks 12–18)
| Activity | Purpose |
|---|---|
| Integrate with planning | Use forecasts |
| Build dashboards | Surface forecasts |
| Automate retraining | Continuous improvement |
| Monitor accuracy | Track performance |
Step 5: Deployment and Optimisation (Weeks 18+)
| Activity | Purpose |
|---|---|
| Deploy to production | Live forecasting |
| Monitor accuracy | Track performance |
| Retrain regularly | Maintain accuracy |
| Expand coverage | More SKUs, stores |
Accuracy and Evaluation
Accuracy Metrics
| Metric | What It Measures |
|---|---|
| MAPE | Mean absolute percentage error |
| RMSE | Root mean squared error |
| MAE | Mean absolute error |
| Bias | Systematic over/under forecasting |
Typical Accuracy
| Data Quality | MAPE |
|---|---|
| Poor data | 30–50% |
| Average data | 20–30% |
| Good data | 10–20% |
| Excellent data | 5–15% |
Improving Accuracy
| Technique | Impact |
|---|---|
| More data | Better patterns |
| Better features | Better signals |
| Ensemble models | Reduced variance |
| Regular retraining | Current patterns |
| Human adjustment | Domain knowledge |
What It Costs in India
Implementation Costs
| Scope | Cost Range (INR) | Cost Range (USD) | Timeline |
|---|---|---|---|
| Basic forecasting (single category) | ₹2,00,000–₹5,00,000 | $2,400–$6,000 | 6–10 weeks |
| Multi-category forecasting | ₹5,00,000–₹12,00,000 | $6,000–$14,400 | 10–16 weeks |
| SKU-level forecasting | ₹8,00,000–₹18,00,000 | $9,600–$21,600 | 14–20 weeks |
| Full demand planning platform | ₹15,00,000–₹35,00,000+ | $18,000–$42,000+ | 20–32 weeks |
Ongoing Costs
| Cost Category | Monthly Range (INR) | Monthly Range (USD) |
|---|---|---|
| Compute (training + serving) | ₹8,000–₹50,000 | $96–$600 |
| Weather data APIs | ₹3,000–₹15,000 | $36–$180 |
| Infrastructure | ₹5,000–₹30,000 | $60–$360 |
| Monitoring and retraining | ₹8,000–₹40,000 | $96–$480 |
ROI Calculation
| Factor | Value |
|---|---|
| Annual revenue | ₹50,00,00,000 |
| Inventory value | ₹10,00,00,000 |
| Inventory reduction (20%) | ₹2,00,00,000 |
| Wastage reduction | ₹50,00,000 |
| Total benefit | ₹2,50,00,000 |
| Implementation cost | ₹12,00,000 |
| Payback period | Under 1 month |
India-Specific Considerations
Indian Demand Patterns
| Factor | Impact |
|---|---|
| Festivals | Major spikes (Diwali, Holi) |
| Monsoon | Seasonal demand shifts |
| Summer | Cooling products |
| Regional variation | Different preferences |
| Wedding season | Specific demand |
Common Indian Use Cases
| Industry | Use Case |
|---|---|
| E-commerce | SKU demand forecasting |
| Retail | Store-level inventory |
| FMCG | Distribution planning |
| Quick commerce | Real-time demand |
| Fresh produce | Perishable forecasting |
| Manufacturing | Production planning |
Compliance
| Requirement | Implementation |
|---|---|
| DPDPA | Data protection |
| Data residency | Where data stored |
| Audit trails | Log all processing |
Decision Framework: Forecasting Readiness
Readiness Scorecard
| Criteria | Weight | Score (1–5) | Weighted Score |
|---|---|---|---|
| Historical data available | 25% | ||
| Data quality | 20% | ||
| Volume justifies investment | 20% | ||
| Integration capability | 15% | ||
| Budget for implementation | 10% | ||
| Team capability | 10% | ||
| Total | 100% | /5 |
Model Selection Matrix
| Your Data | Recommended Model |
|---|---|
| Simple seasonal | Prophet |
| Feature-rich tabular | XGBoost |
| Complex sequential | LSTM |
| Best accuracy needed | Ensemble |
Implementation Roadmap
| Phase | What to Build | Timeline | Cost (INR) |
|---|---|---|---|
| Phase 1 | Data collection, baseline | 4–6 weeks | ₹1,50,000–₹4,00,000 |
| Phase 2 | ML models | 6–8 weeks | ₹3,00,000–₹8,00,000 |
| Phase 3 | Integration, dashboards | 4–6 weeks | ₹2,00,000–₹6,00,000 |
| Phase 4 | Optimisation, expansion | Ongoing | Variable |
Frequently Asked Questions
1. What is AI-powered predictive analytics?
AI predictive analytics uses machine learning to forecast future sales or demand based on historical patterns and external signals like weather, festivals, and promotions.
2. How accurate is AI forecasting?
Typical accuracy is 10–20% MAPE with good data, 5–15% with excellent data. This is 20–40% better than traditional methods.
3. What data do I need for AI forecasting?
Historical sales (1–2 years), SKU data, store data, price data, promotion data, weather data, and festival calendar. Minimum 10,000 records.
4. Which model should I use?
Prophet for simple seasonal data. XGBoost for feature-rich tabular data. LSTM for complex patterns. Ensemble for best accuracy.
5. How much does AI forecasting cost in India?
Basic forecasting costs ₹2,00,000–₹5,00,000 ($2,400–$6,000). SKU-level forecasting costs ₹8,00,000–₹18,00,000 ($9,600–$21,600). Full platforms cost ₹15,00,000–₹35,00,000 ($18,000–$42,000).
6. What is the ROI of AI forecasting?
Inventory reduction (15–30%), stockout reduction (30–50%), and wastage reduction (30–70% for perishables). Payback is often under 1 month.
7. How do Indian festivals affect forecasting?
Festivals create major demand spikes. Diwali, Holi, and regional festivals must be included in forecasting models.
8. Can AI forecasting handle perishables?
Yes, and it delivers the highest ROI. Wastage reduction of 30–70% is typical for fresh produce.
9. How often should models be retrained?
Monthly or quarterly, depending on how quickly patterns change. Continuous retraining improves accuracy.
10. What is feature engineering and why does it matter?
Feature engineering creates the signals models learn from — lag features, rolling averages, weather, festivals. Better features improve accuracy.
11. How does DPDPA affect forecasting?
DPDPA requires data protection and audit trails. Forecasting systems using personal data must comply.
12. How can Innovative AI Solutions help?
Innovative AI Solutions is a Delhi-based AI development company that builds forecasting systems. We implement demand forecasting, sales prediction, and inventory optimisation — designed for Indian demand patterns and DPDPA compliance. Explore our machine learning solutions and AI development services.
Contact Innovative AI Solutions
Ready to forecast sales and demand with AI?
We help Indian businesses build predictive analytics systems that improve forecasting accuracy and reduce inventory costs.
Contact Information
Innovative AI Solutions
📍 Netaji Subhash Place, Pitampura, Delhi – 110034
🌐 Website: https://innovativeais.com 📧 Email: info@innovativeais.com
📞 Phone: +91 7464 099 059 / +91 96899 67356
Business Services
• AI Automation • AI Development • AI Consulting • Machine Learning Solutions • Deep Learning Solutions • Generative AI Services • NLP Solutions • AI Agents • AI Chatbots • Voice AI • CRM Development • Custom Software Development • Website Development • Mobile App Development
About the Author
Abhishek Kumar
Founder & CEO, Innovative AI Solutions
5+ years building production AI systems for Indian businesses. Based in Delhi, serving clients across India.
Ready to build AI solutions for your business?
Innovative AI Solutions — Delhi's leading AI development company. Free consultation available.
Get Free Consultation →
A practical 2026 guide to AI-powered predictive analytics for sales and demand forecasting — models, data requirements, accuracy, and costs for Indian businesses.
#AIPredictiveAnalytics #SalesForecasting #DemandForecasting #2026 #MachineLearning #TimeSeries #DemandPlanning #Inventory #Retail #Models #DataRequirements #Accuracy #Costs #Implementation #India #DelhiNCRTech #EnterpriseApps #StartupApps #BusinessAnalytics #TechIndia #DigitalProducts #Forecasting #PredictiveModels #BusinessIntelligence #InnovativeAISolutions
Copyright © 2015–2026 Innovative AI Solutions. All Rights Reserved. | Privacy Policy | Terms & Conditions