


The Production Blind Spot
An Indian SaaS company deploys a RAG-powered support assistant. The demo was excellent. The first month of production goes smoothly—or so the team believes. Then a customer complains that the assistant gave a wrong answer about a refund policy. The team investigates. They find that the retrieval step has been returning an outdated document for three weeks, ever since a policy update changed the document structure. The model was faithfully summarizing the wrong source. No error was thrown. No alert fired. The system was working exactly as designed—just on the wrong data.
This is the production blind spot in LLM applications. Unlike traditional software, LLMs do not throw exceptions when they are wrong. They produce fluent, confident, plausible output—whether or not it is grounded in reality. Without observability, the first signal of failure is often a customer complaint.
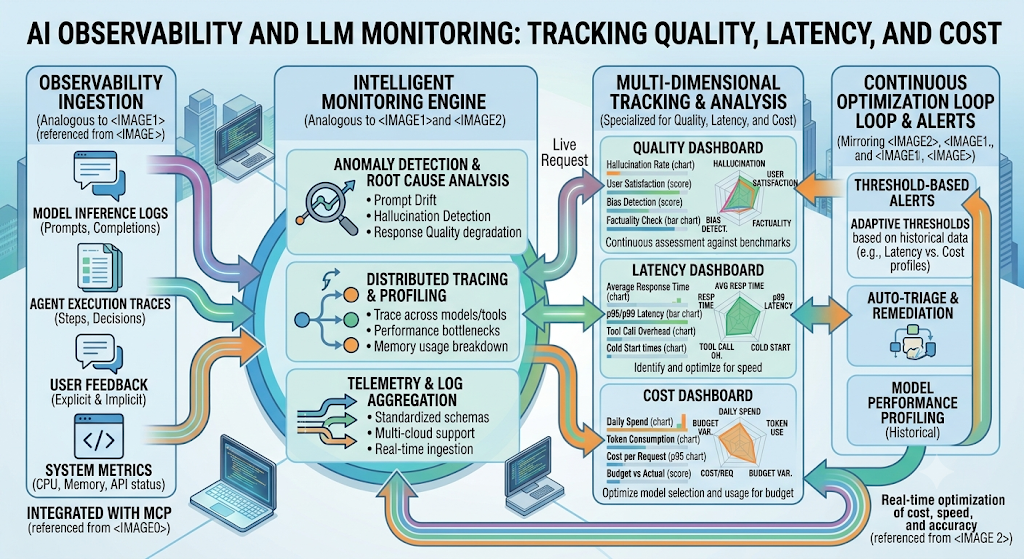
AI observability and LLM monitoring is the discipline of seeing inside the AI system: what the model was asked, what it retrieved, what it generated, how long it took, how much it cost, and whether the output was actually good. It is not a dashboard you install. It is a continuous loop of instrumentation, evaluation, and improvement .
India adds specific considerations. DPDPA applies to observability data that contains personal data—and prompts, completions, and retrieved documents almost always do. Logging raw prompts and completions blindly creates a PII lake that violates the Act . MeitY AI governance expects transparency and accountability, which observability documentation supports. And cost management matters because observability itself consumes storage and compute, and token costs for evaluation can rival the cost of serving.
This guide is written for Indian CTOs, AI engineers, and product managers building LLM applications. We will cover the four pillars of AI observability, the metrics that matter, the tracing architecture, the tool selection, real costs in rupees and dollars, DPDPA compliance, and a phased implementation framework with clear go/no-go gates.
The Four Pillars: Metrics, Logs, Traces, Evaluations
Classic observability rests on metrics, logs, and traces. AI observability keeps all three and adds a fourth that changes everything: evaluations .
Metrics: The Numbers
Metrics quantify performance and economics: latency (p50, p95, p99), token usage, cost per request, error rates, and throughput. They answer the question: how is the system performing?
For LLM systems, key metrics include :
Reliability: success rate, p95 latency, rate-limit hits, retry count.
Cost: average cost per request, token usage by model, cost per successful completion.
Quality: evaluation pass rate, retrieval grounding success, regression delta after model updates.
Safety: guardrail pass rate, PII/toxicity incident frequency.
Logs: The Record
Logs capture the raw record: every prompt, response, retrieved document, tool call, and error with full context . They answer the question: what exactly happened?
The critical best practice: structure over text. Emit JSON logs or structured events that match trace attributes, with correlation IDs (trace_id, span_id, user/workspace identifiers). Log once per logical step. And redact PII before logging—especially prompts and completions .
Traces: The Journey
Traces stitch logs into the journey of a single request across the workflow: RAG retrieval, agent planning, tool chains, memory. In pipeline architectures, the slow or wrong step is rarely where you assume .
A single trace answers questions like :
Which guardrail failed for this request?
Did the model retry or fall back to another provider?
Which tool call caused the slowdown?
How much did this exact output cost?
For RAG pipelines, the span model becomes :
Embedding span: query, embedding model, latency.
Retrieval span: vector store query, documents returned, reranking scores.
Generation span: context length, model call attributes, completion.
Evaluations: The Quality Signal
Evaluations are where AI differs. Automated scoring of groundedness, hallucination, faithfulness, relevance, safety, and task success runs continuously against production traffic. Without evaluations, organisations know that the AI responded, but never whether the response was actually good .
The LLM-as-judge pattern works well: route a sampled subset of production completions (10–20% is typical) to a judge model that scores them against criteria. Write scores back as span attributes so they are queryable alongside latency and cost .
The Four Pillars Table
| Pillar | Question Answered | Key Practice |
|---|---|---|
| Metrics | How is the system performing? | Latency, tokens, cost, success rate |
| Logs | What exactly happened? | Structured JSON, correlation IDs, PII redaction |
| Traces | Where did the request go? | Span hierarchy (embedding, retrieval, generation) |
| Evaluations | Was the output good? | LLM-as-judge, golden sets, human calibration |
For teams building the LLM applications that observability protects, our AI Development and Generative AI Services practices cover the full stack.
What to Monitor: The Six Categories
Failures rarely start where they surface. A wrong answer at the top is often a stale index or schema change two layers down. Effective coverage spans six categories .
1. Infrastructure Health
Latency, availability, GPU and memory pressure, failure rates. Necessary, but only the floor.
2. Model Performance
Token usage, response times, and behaviour across model and prompt versions, so regressions are attributable to a specific change.
3. Output Quality
Hallucination rate, groundedness, accuracy, relevance, and confidence, scored by the evaluation pillar. This is the category that distinguishes AI observability from traditional monitoring.
4. Retrieval Performance
For RAG: retrieval relevance, source freshness, embedding quality, and citation accuracy. A stale index is a silent failure mode that no error log will catch.
5. Agent Behaviour
For agents: tool usage, planning quality, loop detection, task completion, and escalation rates.
6. Business Metrics
User satisfaction, resolution rate, cost per interaction, human overrides, and the KPIs the system exists to move. Human overrides are a particularly honest signal—support teams route around a failing AI long before dashboards admit it .
The Monitoring Priority Table
| Category | What to Track | Why |
|---|---|---|
| Infrastructure | Latency, errors, uptime | Baseline reliability |
| Model performance | Tokens, version regressions | Attributable changes |
| Output quality | Groundedness, relevance | Detects bad answers |
| Retrieval | Relevance, freshness | Catches stale index |
| Agent behaviour | Tool calls, loops | Agent-specific failures |
| Business | Resolution, overrides | Real-world impact |
Tool Selection: Open-Source vs Managed
The LLM observability tooling landscape has matured. Indian teams have options ranging from open-source self-hosted to managed enterprise platforms.
Open-Source Leaders
Langfuse. Open-source (MIT), OpenTelemetry-native, the most adopted open-source tracer (~29.8k stars). Provides tracing, sessions, cost/latency dashboards, evaluation (LLM-as-judge, code evaluators, human annotation), prompt management, and datasets. Self-hostable or managed. Free tier: 50k units/month, 2 users, 30-day access. Core: $29/month, 100k units, unlimited users .
Arize Phoenix. Open-source (Elastic License 2.0), built on OpenTelemetry and OpenInference. The lightest self-host start—one process, no metered events. Strong for agent-trajectory evaluation. Arize AX is the managed platform built on the same standards .
Managed Options
LangSmith. First-party for LangChain/LangGraph. Free tier: 5k base traces/month, 1 seat. Plus: $39/seat/month, 10k base traces. At volume, the cost gap versus Langfuse becomes significant .
Datadog LLM Observability. For teams already on Datadog. Ingests OpenTelemetry but is not OTel-first .
The Self-Hosting Reality
Self-hosting Langfuse is not a single container. It requires web + worker containers, Postgres, ClickHouse, Redis/Valkey, and S3-compatible storage. Phoenix is one process—the lightest start .
For Indian teams: If you cannot run ClickHouse, that decision eliminates Langfuse and Helicone and leaves Phoenix. If you need full evaluation and prompt management with unlimited seats, Langfuse Core at $29/month is compelling. If you are committed to LangChain, LangSmith is the path of least resistance.
Tool Comparison Table
| Tool | Type | Free Tier | Self-Host | Best For |
|---|---|---|---|---|
| Langfuse | Open-source | 50k units, 2 users | Heavy (ClickHouse) | Full platform, unlimited seats |
| Arize Phoenix | Open-source | No caps | Light (one process) | Lightest start, agent eval |
| LangSmith | Managed | 5k traces, 1 seat | Enterprise only | LangChain/LangGraph |
| Datadog | Managed | — | No | Existing Datadog users |
Real Costs in India (2026)
AI observability costs have three components: tooling, infrastructure (if self-hosted), and the evaluation tokens consumed by LLM-as-judge.
Tooling Costs
| Tool | Monthly Cost (₹) | Monthly Cost ($ approx.) | Notes |
|---|---|---|---|
| Langfuse Core | ₹2,400 | $29 | 100k units, unlimited users |
| Langfuse Pro | ₹16,500 | $199 | 3-year retention |
| LangSmith Plus | ₹3,200/seat | $39/seat | 10k base traces, 14-day retention |
| Self-hosted Phoenix | ₹0 (infra only) | $0 | One container, no event caps |
Evaluation Token Costs
LLM-as-judge evaluation consumes tokens. Running a judge on 10–20% of production traffic is the recommended sampling rate . For a system handling 100,000 requests/month, evaluating 10,000 with a mid-tier judge model costs roughly ₹2,000–₹8,000/month depending on prompt length.
Implementation Costs
| Scope | Cost (₹) | Cost ($ approx.) | Timeline |
|---|---|---|---|
| Basic tracing (one tool, metrics, logs) | ₹1–3 lakh | $1,200–$3,600 | 3–6 weeks |
| Full observability (traces, evals, dashboards) | ₹3–8 lakh | $3,600–$9,600 | 6–12 weeks |
| Enterprise observability (multi-app, PII redaction, compliance) | ₹8–20 lakh | $9,600–$24,000 | 12–20 weeks |
The Observability Cost Trade-off
Observability costs money. But the cost of blindness is higher. A single undetected retrieval failure that produces wrong answers for three weeks can damage customer trust and cost far more than the observability that would have caught it.
India-Specific Compliance: DPDPA and Observability
The PII Lake Problem
LLM observability stacks capture prompts, completions, retrieved documents, and tool calls. These contain personal data: customer names, phone numbers, addresses, account details. Logging them raw creates a PII lake that violates DPDPA .
The mitigation:
Redact PII before it reaches the observability backend. Mask, tokenize, or remove personal data at the instrumentation wrapper level, not by relying on developers to remember .
Do not log full prompts and completions blindly. Use span events for content with sanitization filters.
Apply retention policies. Observability data should not be kept longer than necessary.
Vector Stores Are PII Too
Embeddings encode personal data. Encryption, access control, and a real deletion path apply to RAG indexes. If a user requests erasure, the vector store must be updated—not just the primary database .
The Compliance Checklist
| Requirement | Implementation | Priority |
|---|---|---|
| PII redaction | Sanitization at instrumentation wrapper | High |
| Retention policy | TTL on observability data | High |
| Access control | Role-based access to traces | High |
| Deletion support | Erasure across logs and vector stores | High |
| Audit trail | Who accessed what, when | Medium |
Implementation Framework: A Phased Approach With Cost Gates
Phase 1: Instrumentation (Week 1–2)
Objective: Add tracing to the LLM application.
Activities:
Choose tool (Phoenix for lightest start, Langfuse for full platform).
Add OpenTelemetry instrumentation or SDK integration.
Define span hierarchy (embedding, retrieval, generation, tools).
Implement PII redaction at the wrapper level.
Verify traces appear in the backend.
Cost: ₹50,000–₹1.5 lakh ($600–$1,800).
Go/No-Go: Traces visible. PII redacted. Latency overhead acceptable.
Phase 2: Metrics and Dashboards (Week 3–6)
Objective: Build operational and cost dashboards.
Activities:
Configure latency, token, and cost metrics.
Build dashboards by model, prompt version, and user.
Set alerts for latency spikes and cost overruns.
Add business metrics (resolution, overrides).
Cost: ₹1–3 lakh ($1,200–$3,600).
Go/No-Go: Dashboards used by the team. Alerts fire correctly.
Phase 3: Quality Evaluation (Week 7–12)
Objective: Add continuous quality monitoring.
Activities:
Implement LLM-as-judge on sampled production traffic.
Define evaluation criteria (groundedness, relevance, safety).
Write scores back to spans.
Build quality dashboard.
Establish baseline and thresholds.
Cost: ₹2–5 lakh ($2,400–$6,000).
Go/No-Go: Quality scores visible. Regressions detectable.
Phase 4: Continuous Improvement (Ongoing)
Objective: Close the loop.
Activities:
Review quality regressions weekly.
Add production failures to golden dataset.
Tune prompts and retrieval based on traces.
Expand to new models and use cases.
Cost: ₹10,000–₹40,000/month ($120–$480).
Phase Summary Table
| Phase | Duration | Key Deliverable | Cost (₹) | Go/No-Go Criteria |
|---|---|---|---|---|
| 1. Instrumentation | 2 weeks | Traces, PII redaction | 50,000–1.5 lakh | Traces visible |
| 2. Metrics | 4 weeks | Dashboards, alerts | 1–3 lakh | Alerts work |
| 3. Evaluation | 6 weeks | Quality scores | 2–5 lakh | Regressions detectable |
| 4. Improvement | Ongoing | Closed loop | 10,000–40,000/month | Quality improving |
Risks, Pitfalls, and Governance
The Most Common Observability Failures
Logging raw PII. The observability stack becomes a DPDPA liability. Mitigation: Redaction at the wrapper level.
No quality evaluation. The team knows the system responded but not whether it was good. Mitigation: LLM-as-judge on sampled traffic.
No traces. The team cannot see which step failed. Mitigation: Span hierarchy from day one.
Alert fatigue. Too many alerts cause them to be ignored. Mitigation: Alert on quality degradation and cost, not just latency.
No retention policy. Observability data accumulates indefinitely. Mitigation: TTL and automated purge.
Over-reliance on metrics. Latency and cost are easy; quality is hard. Mitigation: Balance all four pillars.
Risk Summary Table
| Risk | Likelihood | Impact | Mitigation |
|---|---|---|---|
| PII in logs | High | Critical (DPDPA) | Redaction |
| No quality eval | High | High (bad answers) | LLM-as-judge |
| No traces | High | Medium (blind debugging) | Span hierarchy |
| Alert fatigue | High | Medium | Tune alerts |
| No retention | High | Medium | TTL, purge |
| Metrics-only | High | High | Four pillars |
Benchmark Summary and Decision Framework
Decision Matrix: Tool Selection
| Your Situation | Recommended Tool |
|---|---|
| Lightest self-host, no ClickHouse | Arize Phoenix |
| Full platform, unlimited seats | Langfuse Core |
| LangChain/LangGraph committed | LangSmith |
| Existing Datadog user | Datadog LLM Obs |
| Agent trajectory evaluation | Arize Phoenix |
Observability Priority Table
| Priority | Capability | Why |
|---|---|---|
| 1 | PII redaction | DPDPA compliance |
| 2 | Tracing (span hierarchy) | Debuggability |
| 3 | Latency and cost metrics | Operational health |
| 4 | Quality evaluation | Detect bad answers |
| 5 | Drift alerts | Catch degradation |
The One-Paragraph Decision Rule
If you are deploying an LLM application, instrument it from day one. Choose Phoenix for the lightest start, or Langfuse for a full platform. Redact PII before it reaches the observability backend. Build the span hierarchy (embedding, retrieval, generation, tools). Add LLM-as-judge on 10–20% of traffic to measure quality. Alert on quality degradation, not just latency. And set retention policies so the observability stack does not become a PII lake.
Frequently Asked Questions
1. What is AI observability and LLM monitoring?
It is the discipline of seeing inside LLM applications: tracing requests across components, measuring latency and cost, evaluating output quality, and detecting degradation before users are affected.
2. What are the four pillars of AI observability?
Metrics (performance), logs (raw record), traces (request journey), and evaluations (quality scoring). Evaluations are the pillar that distinguishes AI observability from traditional monitoring .
3. What should I monitor in an LLM application?
Infrastructure health, model performance, output quality (groundedness, relevance), retrieval performance, agent behaviour (tool calls, loops), and business metrics (resolution, overrides) .
4. Which observability tool should I use?
Arize Phoenix for the lightest self-host start. Langfuse for a full platform with unlimited seats. LangSmith if you are committed to LangChain/LangGraph. Datadog if you already use it .
5. How does DPDPA affect LLM observability?
Prompts, completions, and retrieved documents contain personal data. Logging them raw creates a PII lake that violates DPDPA. Redact PII before it reaches the observability backend .
6. What is LLM-as-judge?
A pattern where a judge model scores production outputs against criteria (groundedness, relevance, safety). Running on 10–20% of traffic gives statistically meaningful signal without doubling inference costs .
7. How much does LLM observability cost?
Basic tracing costs ₹1–3 lakh to implement. Full observability costs ₹3–8 lakh. Tooling ranges from free (self-hosted Phoenix) to $29/month (Langfuse Core) to $39/seat/month (LangSmith Plus) .
8. What is the difference between logs, traces, and metrics?
Logs are the raw record of events. Traces stitch logs into the journey of a single request. Metrics are aggregated numbers for dashboards and alerts.
9. How do I detect a stale RAG index?
Monitor retrieval relevance and source freshness. A trace shows which documents were retrieved; comparing retrieved document dates against the source system reveals staleness.
10. What is the biggest observability mistake?
Logging raw PII. The observability stack becomes a compliance liability. Redaction at the instrumentation wrapper is essential .
11. How long does implementation take?
Basic tracing takes 3–6 weeks. Full observability takes 6–12 weeks. Timeline depends on the number of applications and evaluation requirements.
12. How can Innovative AI Solutions help?
Innovative AI Solutions builds AI observability for Indian businesses—LLM tracing, quality evaluation, latency and cost monitoring, PII redaction, and DPDPA-compliant observability stacks. Our Delhi-based team handles tool selection, implementation, and optimization. Visit https://innovativeais.com to discuss your requirements.
Contact Innovative AI Solutions
Ready to see what your LLM is actually doing in production?
[One-line supporting sentence.]
Contact Information
Innovative AI Solutions
📍 Netaji Subhash Place, Pitampura, Delhi – 110034
🌐 Website: https://innovativeaislabs.com 📧 Email: info@innovativeais.com
📞 Phone: +91 7464 099 059 / +91 96899 67356
Business Services
AI Automation
AI Development
AI Consulting
Machine Learning Solutions
Deep Learning Solutions
Generative AI Services
NLP Solutions
AI Agents
AI Chatbots
Voice AI
CRM Development
Custom Software Development
Website Development
Mobile App Development
About the Author
Abhishek Kumar
Founder & CEO, Innovative AI Solutions
5+ years building production AI systems for Indian businesses. Based in Delhi, serving clients across India.
Ready to build AI solutions for your business?
Innovative AI Solutions — Delhi's leading AI development company. Free consultation available.
Get Free Consultation →
A practical 2026 guide for Indian teams building AI observability—LLM tracing, quality evaluation, latency and cost monitoring, tool selection, real rupee costs, and DPDPA-compliant observability stacks.
#AIObservability #LLMMonitoring #LLMTracing #LLMEvaluation #QualityMonitoring #LatencyTracking #CostMonitoring #Langfuse #ArizePhoenix #OpenTelemetry #LLMAsJudge #HallucinationDetection #DPDPA #MeitY #TokenCost #DelhiNCR #InnovativeAISolutions
Copyright ©️ 2015–2026 Innovative AI Solutions. All Rights Reserved. | Privacy Policy | Terms & Conditions