


The Two Ways Inventory Destroys Margin
An Indian retail chain with 40 stores and a central warehouse faces the same problem every festive season. Some stores run out of the bestselling SKUs in the first week of the sale, losing sales they cannot recover. Other stores are left with slow-moving stock that ties up cash and requires markdowns to clear. The warehouse holds safety stock that is either too much (tying up cash) or too little (causing stockouts).
The finance team sees the result: inventory days are high, cash is locked in stock, and yet customers complain about unavailability. The business is simultaneously overstocked and understocked—because the forecasting is not good enough to match supply to demand at the SKU level, at each location, across seasons.
This is the inventory paradox, and it is where AI inventory forecasting delivers its value. Not by replacing the demand planner, but by giving them a forecast that accounts for seasonality, promotions, festivals, trends, and location-level variation—at a granularity that manual forecasting cannot achieve.
For Indian retail and distribution businesses, this matters because inventory is the largest working capital item. Cash tied up in stock is cash not available for expansion, marketing, or debt reduction. And stockouts are lost sales that damage customer relationships. The businesses that forecast well have a structural advantage: better cash flow, higher availability, and fewer markdowns.
India adds specific considerations. Festive seasonality—Diwali, Dussehra, Eid, Christmas, regional festivals—creates demand spikes that simple forecasting misses. Multi-location complexity—stores, warehouses, distributors—requires location-level forecasting. GST and e-invoicing affect how inventory data flows. DPDPA applies to customer data used in forecasting (loyalty programs, purchase history). And supply chain variability—lead times, supplier reliability, logistics—affects how much safety stock is needed.
This guide is written for Indian retail owners, distribution heads, supply chain managers, and founders evaluating AI forecasting. We will cover the forecasting models, the safety stock calculation, the replenishment automation, real costs in rupees and dollars, DPDPA compliance, and a phased implementation framework with clear go/no-go gates.
What AI Inventory Forecasting Actually Does
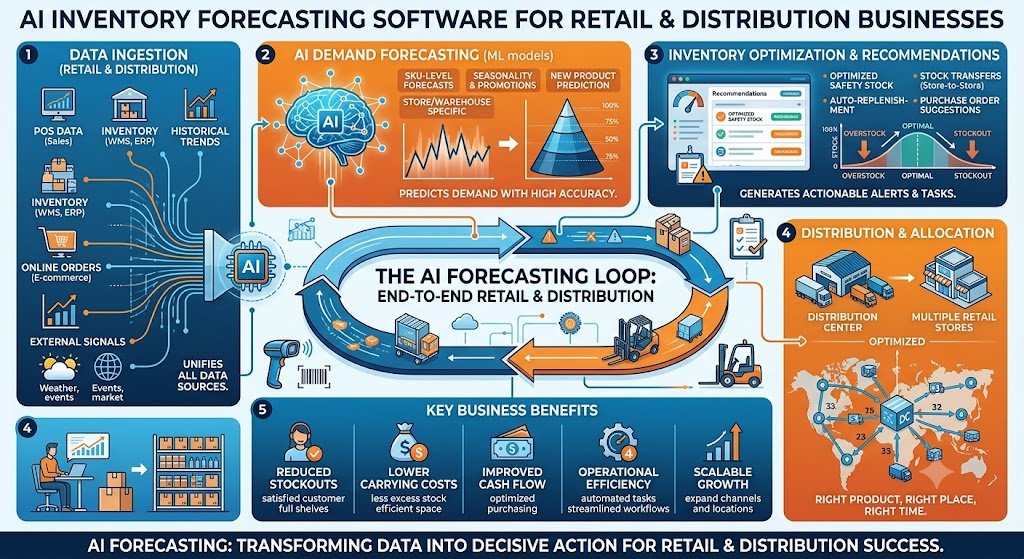
AI inventory forecasting is not a single model. It is a set of capabilities that together determine how much inventory to hold, where, and when to replenish.
The Core Capabilities
1. Demand forecasting. Predict demand for each SKU at each location for each future period. This is the foundation.
2. Safety stock calculation. Determine the buffer stock needed to cover forecast error and supply variability.
3. Replenishment planning. Decide when and how much to order, based on forecast, current stock, lead time, and order constraints.
4. Allocation. Allocate available stock across locations based on forecast and priority.
5. Exception management. Flag SKUs and locations where forecast accuracy is poor or stock is at risk.
6. What-if analysis. Simulate the impact of promotions, price changes, or supply disruptions.
Capability Table
| Capability | What It Does | Business Impact |
|---|---|---|
| Demand forecasting | Predict future demand | Foundation for all decisions |
| Safety stock | Calculate buffer | Reduces stockouts without overstock |
| Replenishment | Decide order timing and quantity | Optimizes cash and availability |
| Allocation | Distribute stock across locations | Improves availability where it matters |
| Exception management | Flag problems | Focuses planner attention |
| What-if analysis | Simulate scenarios | Better planning |
For teams building the forecasting systems and data pipelines, our AI Development and Machine Learning Solutions practices cover the full stack.
Demand Forecasting: The Foundation
Demand forecasting is the core of inventory optimization. If the forecast is wrong, everything downstream is wrong.
The Forecasting Approaches
1. Moving average. Average of recent demand. Simple but ignores seasonality and trends.
2. Exponential smoothing. Weighted average giving more weight to recent demand. Better than moving average but still limited.
3. ARIMA. Statistical model that captures trends and seasonality. Better for stable demand patterns.
4. Machine learning (gradient boosting, neural networks). Models that capture complex patterns including seasonality, promotions, festivals, and external factors. Best for complex demand.
5. Hierarchical forecasting. Forecast at multiple levels (SKU, category, store, region) and reconcile.
Recommendation: Start with exponential smoothing or ARIMA for stable SKUs, and use ML for high-volume or complex SKUs.
The Signals That Drive Demand
1. Historical sales. The primary signal. Past demand predicts future demand.
2. Seasonality. Weekly, monthly, and annual patterns. Festivals, holidays, weather.
3. Promotions. Discounts, offers, and campaigns drive demand spikes.
4. Trends. Long-term growth or decline.
5. Price. Price changes affect demand.
6. External factors. Competitor actions, economic conditions, events.
7. New product launches. Cannibalization and halo effects.
India-Specific Demand Signals
Festive calendar: Diwali, Dussehra, Eid, Christmas, Pongal, Onam, regional festivals.
Wedding season: demand for apparel, jewellery, gifts.
Monsoon: demand for certain categories (rainwear, indoor products).
Exam season: demand for stationery, books, coaching materials.
Cricket season: demand for sports goods, apparel.
Forecasting Table
| Approach | Data Required | Accuracy | Interpretability |
|---|---|---|---|
| Moving average | 3–12 months history | Low | High |
| Exponential smoothing | 12–24 months | Medium | High |
| ARIMA | 24+ months | Medium | Medium |
| ML (gradient boosting) | 24+ months, multiple signals | High | Medium |
| Hierarchical | All of the above | High | Medium |
Safety Stock: The Buffer That Prevents Stockouts
Safety stock is the buffer inventory held to cover forecast error and supply variability. It is the difference between a stockout and a sale.
The Safety Stock Formula
The standard formula:
Safety Stock = Z × σ × √(Lead Time)
Where:
Z is the service level factor (e.g., 1.65 for 95% service level).
σ is the standard deviation of demand.
Lead Time is the replenishment lead time.
Why AI Improves Safety Stock
Traditional safety stock uses a single standard deviation for all SKUs. AI improves this by:
SKU-level variability: different SKUs have different demand variability.
Location-level variability: different stores have different variability.
Seasonal variability: variability changes by season.
Lead time variability: supplier lead times vary.
Forecast error: safety stock should account for the actual forecast error, not a generic assumption.
The Service Level Trade-off
Higher service levels require more safety stock. The right service level depends on the SKU:
A-class SKUs (high value, high volume): 95–98% service level.
B-class SKUs: 90–95%.
C-class SKUs (low value, low volume): 85–90%.
Safety Stock Table
| SKU Class | Service Level | Safety Stock |
|---|---|---|
| A | 95–98% | Higher |
| B | 90–95% | Medium |
| C | 85–90% | Lower |
Replenishment: When and How Much to Order
Replenishment planning decides when to order and how much. It balances availability against cash and storage costs.
The Replenishment Approaches
1. Reorder point. Order when stock falls below a threshold (reorder point = safety stock + demand during lead time).
2. Periodic review. Review stock at fixed intervals and order up to a target level.
3. Min-max. Maintain stock between a minimum and maximum level.
4. Economic order quantity (EOQ). Order the quantity that minimizes ordering and holding costs.
5. AI-optimized. Use forecast, lead time, and cost data to optimize order timing and quantity dynamically.
The Constraints
Minimum order quantities (MOQ): suppliers may require minimum orders.
Order multiples: orders may need to be in case packs or pallets.
Storage capacity: warehouse and store space is limited.
Lead time: orders must account for supplier lead time.
Budget: orders must fit within cash constraints.
Replenishment Table
| Approach | Complexity | Best For |
|---|---|---|
| Reorder point | Low | Stable demand |
| Periodic review | Low | Regular ordering cycles |
| Min-max | Low | Simple operations |
| EOQ | Medium | Cost optimization |
| AI-optimized | High | Complex, multi-SKU |
Real Costs in India (2026)
AI inventory forecasting costs depend on the scope: basic forecasting, or full optimization with replenishment and allocation.
Implementation Costs
| Scope | Cost (₹) | Cost ($ approx.) | Timeline |
|---|---|---|---|
| Basic demand forecasting | ₹2–5 lakh | $2,400–$6,000 | 6–10 weeks |
| Forecasting + safety stock | ₹4–10 lakh | $4,800–$12,000 | 10–16 weeks |
| Full optimization (forecasting, safety stock, replenishment) | ₹10–25 lakh | $12,000–$30,000 | 16–28 weeks |
| Enterprise platform (multi-location, allocation, what-if) | ₹25–60 lakh | $30,000–$72,000 | 24–36 weeks |
Running Costs
| Component | Monthly Cost (₹) | Monthly Cost ($ approx.) | Notes |
|---|---|---|---|
| Hosting | ₹10,000–₹50,000 | $120–$600 | Cloud infrastructure |
| Data pipeline | ₹5,000–₹30,000 | $60–$360 | ETL, data warehouse |
| ML infrastructure | ₹5,000–₹30,000 | $60–$360 | Model training and serving |
| Maintenance | ₹15,000–₹75,000 | $180–$900 | 15–25% of build annually |
The ROI Case
For a retailer with ₹50 crore annual inventory:
Inventory carrying cost: 20% = ₹10 crore.
Reduction from better forecasting: 15% = ₹1.5 crore.
Annual saving: ₹1.5 crore.
Payback: 2–6 months on a ₹10–25 lakh implementation.
Plus, the reduction in stockouts increases sales and customer satisfaction.
India-Specific Compliance: DPDPA and GST
DPDPA
Inventory forecasting uses customer data (loyalty programs, purchase history) and employee data (sales staff performance). Under the DPDP Act:
Consent: customers must consent to their data being used for analytics.
Purpose limitation: data used for forecasting should not be repurposed.
Data minimisation: use only the data needed.
Retention: define retention periods.
GST and E-Invoicing
Inventory data flows from sales and purchase transactions, which are GST-compliant. The forecasting system should integrate with:
Sales data: from POS and e-commerce.
Purchase data: from purchase orders and invoices.
Inventory data: from warehouse management systems.
MeitY AI Governance
If AI is used for forecasting:
Transparency: planners should understand how forecasts are generated.
Accountability: a named owner for forecast accuracy.
Human oversight: planners should be able to override forecasts.
Compliance Checklist
| Requirement | Implementation | Priority |
|---|---|---|
| Customer consent | Loyalty program opt-in | High |
| Purpose limitation | Analytics-only use | Medium |
| Data minimisation | Only needed fields | Medium |
| Retention policy | Automated purge | Medium |
| Forecast transparency | Explainable models | Medium |
Implementation Framework: A Phased Approach With Cost Gates
Phase 1: Data Audit (Week 1–3)
Objective: Understand data availability and quality.
Activities:
Inventory data sources: POS, e-commerce, WMS, ERP.
Assess data quality: completeness, accuracy, history.
Identify gaps: missing SKUs, missing locations, missing history.
Assess forecasting maturity.
Cost: ₹50,000–₹1.5 lakh ($600–$1,800).
Go/No-Go: Data sufficient for forecasting. Gaps identified.
Phase 2: Demand Forecasting (Week 4–12)
Objective: Implement demand forecasting.
Activities:
Build data pipeline.
Implement forecasting models (exponential smoothing, ML).
Validate against historical data.
Build dashboard for planners.
Train planners.
Cost: ₹2–5 lakh ($2,400–$6,000).
Go/No-Go: Forecast accuracy improves on baseline. Planners use it.
Phase 3: Safety Stock (Week 13–18)
Objective: Implement AI-based safety stock calculation.
Activities:
Calculate SKU-level, location-level variability.
Implement safety stock formula.
Set service levels by SKU class.
Integrate with inventory system.
Cost: ₹2–5 lakh ($2,400–$6,000).
Go/No-Go: Safety stock reflects actual variability. Stockouts reduced.
Phase 4: Replenishment (Week 19–26)
Objective: Automate replenishment recommendations.
Activities:
Implement replenishment logic.
Configure constraints (MOQ, order multiples).
Build approval workflow.
Integrate with procurement.
Cost: ₹3–8 lakh ($3,600–$9,600).
Go/No-Go: Replenishment recommendations work. Planners trust them.
Phase 5: Optimization (Ongoing)
Objective: Improve continuously.
Activities:
Monitor forecast accuracy.
Tune models.
Add allocation and what-if analysis.
Expand to more SKUs and locations.
Cost: ₹15,000–₹75,000/month ($180–$900).
Phase Summary Table
| Phase | Duration | Key Deliverable | Cost (₹) | Go/No-Go Criteria |
|---|---|---|---|---|
| 1. Data Audit | 3 weeks | Data assessment | 50,000–1.5 lakh | Data sufficient |
| 2. Forecasting | 9 weeks | Demand forecasts | 2–5 lakh | Accuracy improves |
| 3. Safety Stock | 6 weeks | Buffer calculation | 2–5 lakh | Stockouts reduced |
| 4. Replenishment | 8 weeks | Order recommendations | 3–8 lakh | Planners trust |
| 5. Optimization | Ongoing | Continuous improvement | 15,000–75,000/month | Accuracy improving |
Risks, Pitfalls, and Governance
The Most Common Forecasting Failures
Poor data quality. Missing sales history, inaccurate stock counts. Mitigation: Data audit, cleanup.
Ignoring seasonality. Forecasts that miss festive spikes. Mitigation: Seasonal models, festival calendar.
Over-reliance on AI. Planners trust forecasts without judgment. Mitigation: Human oversight, exception review.
No feedback loop. Models do not improve. Mitigation: Monitor accuracy, retrain.
Ignoring constraints. Forecasts that cannot be fulfilled due to supply constraints. Mitigation: Constraint-aware replenishment.
DPDPA violations. Customer data used without consent. Mitigation: Consent, purpose limitation.
Risk Summary Table
| Risk | Likelihood | Impact | Mitigation |
|---|---|---|---|
| Poor data quality | High | High (bad forecasts) | Data audit |
| Ignoring seasonality | High | High (stockouts) | Seasonal models |
| Over-reliance on AI | Medium | Medium | Human oversight |
| No feedback loop | High | Medium | Monitor, retrain |
| Ignoring constraints | Medium | Medium | Constraint-aware |
| DPDPA violations | Medium | High | Consent |
Benchmark Summary and Decision Framework
Decision Matrix: Build vs Buy
| Factor | Build Custom | Buy Forecasting Software |
|---|---|---|
| Unique demand patterns | Industry-specific | Standard retail |
| Integration | Custom ERP/WMS | Standard connectors |
| Cost | Higher upfront | Subscription |
| Time to market | 16–28 weeks | Weeks |
| Best for | Large retailers, distributors | Mid-sized businesses |
Forecasting Priority Table
| SKU Type | Forecast Approach | Service Level |
|---|---|---|
| A-class, stable | ML | 95–98% |
| A-class, seasonal | ML + seasonality | 95–98% |
| B-class | Exponential smoothing | 90–95% |
| C-class | Moving average | 85–90% |
The One-Paragraph Decision Rule
If your inventory is both overstocked and understocked, start with demand forecasting at the SKU and location level. Add safety stock calculation based on actual variability. Add replenishment automation once the forecast is trusted. Include the festival calendar and promotion data in the model. Keep planners in the loop for exceptions. And ensure DPDPA compliance for customer data used in forecasting.
Frequently Asked Questions
1. How much does AI inventory forecasting cost in India?
Basic demand forecasting costs ₹2–5 lakh ($2,400–$6,000). Forecasting + safety stock costs ₹4–10 lakh ($4,800–$12,000). Full optimization costs ₹10–25 lakh ($12,000–$30,000).
2. How accurate is AI demand forecasting?
Accuracy varies by SKU and data quality. AI typically improves forecast accuracy by 20–40% over manual methods, with higher accuracy for stable, high-volume SKUs.
3. What is safety stock?
Safety stock is the buffer inventory held to cover forecast error and supply variability. It prevents stockouts when demand exceeds forecast or supply is delayed.
4. How does AI improve safety stock?
AI calculates safety stock at the SKU and location level based on actual variability, rather than using a single assumption for all SKUs. This reduces both stockouts and overstock.
5. What is replenishment planning?
Replenishment planning decides when and how much to order, based on forecast, current stock, lead time, and constraints.
6. How do I include festival seasonality in forecasts?
Use a festival calendar that maps Indian festivals (Diwali, Dussehra, Eid, etc.) to demand patterns. ML models can learn the uplift associated with each festival.
7. How does DPDPA affect inventory forecasting?
Customer data used in forecasting (loyalty programs, purchase history) requires consent, purpose limitation, and data minimisation.
8. Can AI forecast new products?
New products without history are challenging. Use analog forecasting (similar products), market research, and early sales data to bootstrap forecasts.
9. How long does implementation take?
Basic forecasting takes 6–10 weeks. Full optimization takes 16–28 weeks. Timeline depends on data quality and integration complexity.
10. Should I build or buy forecasting software?
Build if you have unique demand patterns or complex integrations. Buy if you have standard retail demand and need to move fast.
11. What metrics should I track?
Forecast accuracy (MAPE, bias), stockout rate, inventory turns, days of inventory, and service level.
12. How can Innovative AI Solutions help?
Innovative AI Solutions builds AI inventory forecasting systems for Indian retailers and distributors—demand prediction, safety stock, replenishment automation, and DPDPA-compliant data handling. Our Delhi-based team handles assessment, implementation, and optimization. Visit https://innovativeais.com to discuss your requirements.
Contact Innovative AI Solutions
Ready to stop being both overstocked and understocked?
[One-line supporting sentence.]
Contact Information
Innovative AI Solutions
📍 Netaji Subhash Place, Pitampura, Delhi – 110034
🌐 Website: https://innovativeaislabs.com 📧 Email: info@innovativeais.com
📞 Phone: +91 7464 099 059 / +91 96899 67356
Business Services
AI Automation
AI Development
AI Consulting
Machine Learning Solutions
Deep Learning Solutions
Generative AI Services
NLP Solutions
AI Agents
AI Chatbots
Voice AI
CRM Development
Custom Software Development
Website Development
Mobile App Development
About the Author
Abhishek Kumar
Founder & CEO, Innovative AI Solutions
5+ years building production AI systems for Indian businesses. Based in Delhi, serving clients across India.
Ready to build AI solutions for your business?
Innovative AI Solutions — Delhi's leading AI development company. Free consultation available.
Get Free Consultation →
A practical 2026 guide for Indian retailers and distributors implementing AI inventory forecasting—demand prediction, safety stock, replenishment automation, festive seasonality, real rupee costs, and DPDPA compliance.
#AIInventoryForecasting #DemandForecasting #InventoryOptimization #SafetyStock #Replenishment #RetailAI #Distribution #SeasonalDemand #Stockouts #Overstock #SupplyChainAI #DPDPA #MeitY #DemandPlanning #DelhiNCR #InnovativeAISolutions
Copyright ©️ 2015–2026 Innovative AI Solutions. All Rights Reserved. | Privacy Policy | Terms & Conditions