


The Visibility Gap That Costs Indian Logistics Every Day
A mid-sized Indian transport company runs 120 trucks. The operations head starts the day with a set of phone calls: where is the Delhi-bound truck, did the Pune delivery reach on time, which driver is available for the next load, and why has a vehicle been idle for six hours. By the time the answers are collected, the morning dispatch window has already slipped.
This is the visibility gap, and it is the defining operational problem in Indian logistics. The fleet is moving, the loads are booked, and the drivers are working—but the business does not know what is happening in real time. Dispatch decisions are made on phone calls. Route choices are based on driver experience. Fuel costs are discovered at month-end. Customer queries about delivery status are answered by calling the driver.
The economics of closing this gap are substantial. Fuel typically accounts for 30–40% of operating cost in Indian road transport. Empty running—trucks travelling without a load—is a persistent inefficiency. Delayed dispatch means delayed billing and delayed cash flow. And customer expectations are rising: e-commerce has trained B2B buyers to expect real-time tracking, and enterprise shippers increasingly require proof of delivery and route compliance.
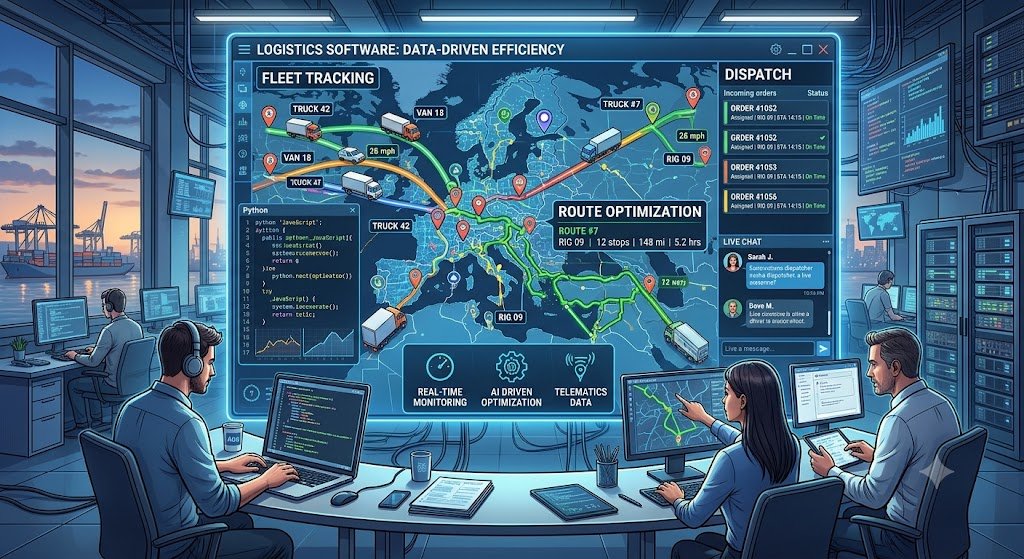
Logistics software development is the discipline of building the systems that close this gap: fleet tracking that shows where vehicles are, dispatch automation that assigns loads efficiently, and route optimization that reduces distance and fuel. It is not a single product. It is a set of connected modules that together give the business real-time control over a mobile, distributed operation.
India adds specific requirements. E-way bill compliance is mandatory for goods movement above a threshold. FASTag has digitised toll payments and provides a data stream. GST invoicing must align with dispatch. Driver data is personal data under the DPDP Act. And the network reality—patchy connectivity on highways, varied vehicle types, multi-language drivers—shapes the architecture.
This guide is written for Indian logistics business owners, fleet operators, 3PL providers, and CTOs evaluating logistics software. We will cover the architecture that connects fleet tracking, dispatch, and route optimization; the modules that deliver value first; real costs in rupees and dollars; India-specific compliance (e-way bill, FASTag, DPDPA); and a phased implementation framework with clear go/no-go gates.
What "Fleet Tracking, Dispatch and Route Optimization" Actually Means The three terms are often used loosely. Each is a distinct capability with its own data requirements and its own return.
Fleet Tracking: Knowing Where Things Are
Fleet tracking is the real-time location and status of vehicles, drivers, and shipments. At its simplest, it is a GPS device on a truck sending location to a dashboard. At its fullest, it includes:
Location and movement: GPS position, speed, heading, stoppage detection.
Vehicle telemetry: fuel level, engine status, odometer, temperature (for cold chain).
Driver behaviour: harsh braking, over-speeding, idling, route deviation.
Geofencing: alerts when a vehicle enters or leaves a defined area (warehouse, customer site, restricted zone).
Trip history: routes taken, stops made, time at each stop.
The value of fleet tracking is visibility: the operations team can answer "where is the truck?" without calling the driver, and exceptions (idling, deviation, over-speeding) surface automatically.
Dispatch Management: Assigning Loads Efficiently
Dispatch is the process of matching loads to vehicles and drivers, and communicating the assignment. In many Indian operations, this happens on phone calls and WhatsApp groups. A dispatch module brings structure:
Load capture: order details, pickup and delivery locations, weight, time window.
Vehicle and driver availability: who is free, where they are, what they can carry.
Assignment: match load to vehicle and driver, with rules for capacity, distance, and priority.
Communication: push the trip details to the driver's app, with turn-by-turn navigation and proof-of-delivery capture.
Status tracking: assigned, picked up, in transit, delivered, POD captured.
The value of dispatch automation is speed and utilisation: fewer phone calls, faster assignment, better matching of loads to available capacity.
Route Optimization: Reducing Distance and Fuel
Route optimization is the computational problem of finding the best sequence of stops for a set of deliveries, subject to constraints (vehicle capacity, time windows, driver hours, road restrictions). For a single vehicle with ten stops, there are 3.6 million possible sequences. For a fleet with multiple vehicles, the problem grows exponentially.
Route optimization software uses algorithms—from simple greedy heuristics to advanced metaheuristics and, increasingly, machine learning—to find good solutions quickly.
Single-vehicle routing: the optimal sequence for one vehicle's stops.
Multi-vehicle routing: assigning stops to vehicles and sequencing each vehicle.
Dynamic routing: re-optimising when new orders arrive or conditions change.
Constraint handling: time windows, capacity, driver hours, vehicle restrictions (height, weight, no-entry zones).
The value of route optimization is cost: shorter distance, less fuel, more stops per vehicle, and better on-time performance.
Capability Comparison Table
| Capability | Core Question Answered | Primary Data | Typical Indian State |
|---|---|---|---|
| Fleet tracking | Where is the vehicle now? | GPS, telematics | Partial (GPS devices, no integration) |
| Dispatch management | Which vehicle should carry this load? | Orders, availability, capacity | Manual (phone, WhatsApp) |
| Route optimization | What is the best sequence of stops? | Stops, distances, constraints | Driver experience |
For teams building the integration layer that connects these modules to ERP and billing, our Custom Software Development and AI Automation practices cover the full stack.
The Architecture: Building a Connected Logistics Platform
A logistics platform has several layers, each with distinct responsibilities. Understanding them prevents the common mistake of treating fleet tracking as the whole system.
Layer 1: Telematics and Data Ingestion
This is the layer that captures data from the field: GPS devices, telematics units, driver smartphones, fuel sensors, and temperature sensors. Data arrives via cellular networks, often intermittently.
India-specific considerations:
Connectivity gaps: highways and rural routes have patchy coverage. The system must buffer data on the device and sync when connectivity returns.
Device heterogeneity: fleets often have a mix of GPS device brands and generations. The ingestion layer must normalise data from multiple protocols.
FASTag data: toll transactions provide a useful location and timing signal. Integration with FASTag data can supplement GPS.
Driver smartphones: for smaller fleets without dedicated GPS devices, a driver app can serve as the tracking device—with the caveat that it depends on the driver keeping the app running.
Layer 2: Core Platform (Tracking, Dispatch, Routing)
This is the operational core:
Tracking service: stores and serves real-time location, trip history, and geofence events.
Dispatch service: manages loads, vehicle availability, assignment, and trip lifecycle.
Routing engine: computes optimized routes given stops and constraints.
Notification service: alerts for exceptions (idling, deviation, delay) and status updates.
Layer 3: Driver and Customer Interfaces
Driver app: trip details, navigation, status updates, POD capture (photo, signature, OTP), expense capture.
Customer portal: shipment tracking, ETA, POD download.
Dispatcher dashboard: real-time fleet view, assignment tools, exception alerts.
Layer 4: Integration and Compliance
ERP integration: orders in, trip status out, billing triggers.
E-way bill integration: generation and validation for goods movement.
FASTag integration: toll transaction data for reconciliation.
GST invoicing: alignment of dispatch with invoice generation.
Analytics: fuel consumption, utilisation, on-time performance, cost per km.
The Architecture at a Glance
| Layer | Components | India-Specific Consideration |
|---|---|---|
| Telematics | GPS, telematics, driver app, FASTag | Connectivity gaps, device heterogeneity |
| Core platform | Tracking, dispatch, routing, notifications | Real-time constraints, multi-language |
| Interfaces | Driver app, customer portal, dispatcher dashboard | Low-end Android devices, offline mode |
| Integration | ERP, e-way bill, FASTag, GST, analytics | E-way bill compliance, FASTag data |
Build vs Buy: The Platform Decision
Most Indian logistics companies do not need to build every layer. GPS tracking hardware and telematics platforms are mature and can be bought. The differentiation lies in dispatch logic, route optimization, and integration with the company's specific ERP and billing processes.
| Component | Build vs Buy | Rationale |
|---|---|---|
| GPS hardware | Buy | Commodity, mature vendors |
| Telematics platform | Buy or partner | Mature, integration-heavy |
| Dispatch module | Build or configure | Company-specific workflows |
| Route optimization | Build or API | APIs available; custom for complex constraints |
| Driver app | Build | Company-specific UX and workflows |
| ERP integration | Build | Company-specific systems |
Modules That Matter: What to Build First
The sequence below reflects the order in which most Indian logistics companies see return.
Module Priority
| Module | Business Value | Complexity | Recommended Order |
|---|---|---|---|
| Fleet tracking dashboard | High (visibility) | Medium | 1 |
| Driver app with trip details | High (dispatch speed) | Medium | 2 |
| Dispatch management | High (utilisation) | Medium-High | 3 |
| E-way bill integration | High (compliance) | Low-Medium | 2 (compliance enabler) |
| Route optimization | High (fuel, time) | High | 4 |
| POD capture and customer portal | Medium-High (customer trust) | Medium | 3 |
| Fuel and expense tracking | Medium (cost control) | Low-Medium | 4 |
| Analytics and reporting | Medium (management) | Medium | 5 |
| Predictive maintenance | Medium (long-term) | High | 6 |
Fleet Tracking: The Starting Point
Fleet tracking is the natural starting point because it delivers immediate visibility and builds the data foundation for everything else. A tracking dashboard that shows vehicle locations, trip status, and exceptions gives the operations team a single view that replaces phone calls.
Key features:
Live map with vehicle positions and status.
Trip list with current status (assigned, picked up, in transit, delivered).
Exception alerts: idling, route deviation, over-speeding, delayed ETA.
Trip history and playback.
Dispatch Management: The Utilisation Lever
Dispatch management is where utilisation improves. The goal is to assign loads to vehicles quickly and efficiently, reducing idle time and empty running.
Key features:
Load board: pending loads with pickup, delivery, weight, and time window.
Vehicle availability: which vehicles are free, where, and what they can carry.
Assignment: manual or rule-based matching.
Trip creation: push to driver app with all details.
Status lifecycle: assigned → picked up → in transit → delivered → POD.
Route Optimization: The Fuel Lever
Route optimization is where fuel and time savings are realized. For companies with many stops per vehicle (last-mile delivery, distribution), the savings can be substantial.
Key features:
Multi-stop optimization for a single vehicle.
Multi-vehicle optimization with capacity and time-window constraints.
Dynamic re-optimization when new orders arrive.
Integration with maps and traffic data.
The AI angle: Modern route optimization can use machine learning to predict travel times (accounting for traffic patterns, time of day, and historical data), learn driver preferences, and adapt to recurring constraints. This is where AI adds value beyond classical optimization algorithms.
Proof of Delivery: The Customer Trust Lever
POD capture closes the loop: the customer gets confirmation that the goods arrived, and the business has evidence for billing and dispute resolution.
Key features:
Photo capture at delivery.
Signature capture (digital).
OTP confirmation.
Timestamp and geolocation.
Customer portal for POD download.
Module Build vs Buy Table
| Module | Build Custom | Buy Standard | Notes |
|---|---|---|---|
| Tracking dashboard | If unique | If standard | Telematics vendors offer dashboards |
| Driver app | Usually build | If standard | Company-specific workflows |
| Dispatch | If complex | If standard | TMS software is mature |
| Route optimization | If complex constraints | API (Google, HERE, etc.) | APIs are mature and affordable |
| POD | Usually build | If standard | Integrated with driver app |
| E-way bill | Integrate | API | Government API integration |
Real Costs in India (2026)
Logistics software costs depend on the number of vehicles, the modules built, whether GPS hardware is needed, and the extent of integration.
Build Costs by Scope
| Scope | Build Cost (₹) | Build Cost ($ approx.) | Timeline | What It Covers |
|---|---|---|---|---|
| Fleet tracking dashboard | ₹5–12 lakh | $6,000–$14,400 | 8–12 weeks | Live map, trip list, exceptions, history |
| Tracking + driver app | ₹10–22 lakh | $12,000–$26,400 | 12–18 weeks | Dashboard + driver app with status updates and POD |
| Full dispatch + tracking | ₹20–45 lakh | $24,000–$54,000 | 18–28 weeks | Dispatch module, load board, assignment, tracking |
| Enterprise logistics platform | ₹40–90 lakh | $48,000–$1,08,000 | 24–36 weeks | Full platform with route optimization, ERP integration, analytics |
Note: USD conversions at ₹83/$. These ranges are indicative for Indian development teams and include design, development, and basic testing. They exclude GPS hardware, maps API costs, and integration with legacy ERP systems that may require custom connectors.
Hardware and Infrastructure Costs
| Item | Cost (₹) | Cost ($ approx.) | Notes |
|---|---|---|---|
| GPS tracking device (per vehicle) | ₹2,000–₹8,000 | $24–$96 | Basic vs telematics |
| Fuel sensor (per vehicle) | ₹5,000–₹15,000 | $60–$180 | Optional, for fuel monitoring |
| Temperature sensor (cold chain) | ₹3,000–₹10,000 | $36–$120 | Optional |
| Driver smartphone | ₹8,000–₹15,000 | $96–$180 | If not provided by driver |
| Maps API | ₹5,000–₹30,000/month | $60–$360/month | Google Maps, HERE, Mapbox |
| Hosting infrastructure | ₹10,000–₹50,000/month | $120–$600/month | Depends on fleet size |
Running Costs
| Cost Component | Monthly Range (₹) | Monthly Range ($ approx.) | Notes |
|---|---|---|---|
| Hosting and infrastructure | ₹10,000–₹50,000 | $120–$600 | Scales with fleet size |
| Maps and routing API | ₹5,000–₹30,000 | $60–$360 | Per-request pricing |
| SMS/notifications | ₹2,000–₹10,000 | $24–$120 | Per-message pricing |
| Support and maintenance | ₹15,000–₹75,000 | $180–$900 | 15–25% of build annually |
| GPS data connectivity | ₹50–₹150 per vehicle/month | $0.60–$1.80 | SIM data plans |
The Hidden Costs
GPS device installation and maintenance. Devices fail, SIMs run out of data, and installations need to be managed across a distributed fleet.
Data quality. GPS data is noisy—urban canyons, tunnels, and device errors create false stops and route deviations. The system must filter and validate.
Driver adoption. A driver app is only useful if drivers use it. Training, incentives, and a simple UX are essential.
Map data accuracy for India. Road networks, addresses, and landmarks in India are inconsistent. Map providers vary in coverage. Testing route quality on real Indian roads is essential.
India-Specific Compliance: E-Way Bill, FASTag and DPDPA
E-Way Bill Compliance
E-way bill generation is mandatory for the movement of goods above a threshold value (currently ₹50,000 in most states, with variations). For logistics software, this means:
Generation at dispatch: the system must generate the e-way bill when goods are dispatched, with the correct consignment details.
Part B updates: vehicle number changes during transit require Part B updates.
Validation: the e-way bill must be valid for the duration of the journey.
Integration: the system should call the government e-way bill API and store the e-way bill number with the trip record.
Integration pattern: The dispatch module calls the e-way bill API, receives the EWB number, and stores it against the trip. Driver app shows the EWB number; customer portal provides it for download.
FASTag Integration
FASTag has digitised toll payments and provides a data stream that can supplement GPS tracking.
Use cases:
Toll reconciliation: match FASTag transactions to trips for accurate cost allocation.
Location signal: toll plaza crossings provide a location and timing signal that can validate GPS data.
Fuel and expense tracking: toll costs are captured automatically, reducing manual expense entry.
Integration: FASTag data is available from banks and NPCI. Integration requires agreements with the issuing banks or a third-party aggregator.
DPDPA: Driver and Customer Data
Logistics software processes personal data: driver identity, contact details, driving behaviour, and customer addresses and phone numbers. Under the DPDP Act, this data is subject to consent, purpose limitation, and security obligations.
Key considerations:
Driver data: location tracking and driving behaviour data are personal data. Drivers should be informed about what is collected and why. Consent and purpose limitation apply.
Customer data: delivery addresses and phone numbers are personal data. Data minimisation applies—collect only what is needed for delivery.
Access control: drivers should see only their own trips; dispatchers see the fleet; customers see only their shipments.
Audit logging: access to personal data should be logged for accountability.
Retention: define retention periods for trip data and driver behaviour data.
MeitY AI Governance Guidelines
If the platform uses AI for route optimization, ETA prediction, or driver behaviour scoring, MeitY's seven Sutras apply:
Transparency: drivers should know when AI is scoring their behaviour.
Accountability: a named owner for AI-driven decisions.
Human oversight: AI recommendations (routes, ETAs) should be overridable by dispatchers.
Compliance Checklist
| Requirement | Implementation | Priority |
|---|---|---|
| E-way bill generation | Dispatch module calls EWB API | High |
| FASTag reconciliation | Integration with bank/aggregator | Medium |
| Driver consent | Inform drivers about tracking | High |
| Customer data minimisation | Collect only delivery-necessary data | Medium |
| Role-based access | Driver, dispatcher, customer roles | High |
| Audit logging | Access to personal data logged | High |
| AI transparency | Disclose AI scoring to drivers | Medium |
Implementation Framework: A Phased Approach With Cost Gates
Phase 1: Fleet Visibility Audit (Week 1–2)
Objective: Understand the current fleet, data sources, and pain points.
Activities:
Inventory the fleet: vehicle types, GPS devices, telematics capabilities.
Map current dispatch processes: how are loads assigned today? What are the bottlenecks?
Assess data quality: are GPS devices installed and working? Is data accessible?
Identify the highest-value pain point: visibility, dispatch speed, or route cost?
Assess ERP integration: how do orders arrive, and how does billing work?
Cost: ₹50,000–₹1.5 lakh ($600–$1,800) for audit.
Go/No-Go: Clear pain point, data sources identified, integration path understood.
Phase 2: Fleet Tracking Dashboard (Week 3–10)
Objective: Build real-time visibility into fleet location and trip status.
Activities:
Integrate GPS/telematics data ingestion.
Build live map with vehicle positions and status.
Build trip list with status lifecycle.
Exception alerts: idling, deviation, over-speeding.
Trip history and playback.
Cost: ₹5–12 lakh ($6,000–$14,400).
Go/No-Go: Operations team uses the dashboard daily. Location accuracy is acceptable. Exceptions are useful.
Phase 3: Driver App and Dispatch (Week 11–20)
Objective: Digitise dispatch and give drivers a tool for trip management.
Activities:
Driver app: trip details, navigation, status updates, POD capture.
Dispatch module: load board, vehicle availability, assignment.
E-way bill integration at dispatch.
Customer status notifications.
Cost: ₹10–22 lakh ($12,000–$26,400).
Go/No-Go: Drivers use the app consistently. Dispatch time reduced. POD capture works.
Phase 4: Route Optimization and Analytics (Week 21–30)
Objective: Reduce distance and fuel through optimized routing.
Activities:
Route optimization engine: single and multi-vehicle.
Integration with maps and traffic data.
Dynamic re-optimization for new orders.
Analytics: fuel consumption, utilisation, on-time performance.
FASTag reconciliation.
Cost: ₹10–25 lakh ($12,000–$30,000).
Go/No-Go: Route optimization delivers measurable distance or fuel reduction. Analytics are used in management reviews.
Phase 5: Scale and Advanced Features (Month 8–12)
Objective: Expand to full fleet and add advanced capabilities.
Activities:
Scale to all vehicles and routes.
Predictive maintenance (if justified).
AI ETA prediction.
Customer self-service portal.
ERP integration for automated billing.
Cost: ₹15–40 lakh ($18,000–$48,000) depending on scope.
Go/No-Go: Measurable improvement in cost per km, on-time delivery, or utilisation.
Phase Summary Table
| Phase | Duration | Key Deliverable | Cost (₹) | Go/No-Go Criteria |
|---|---|---|---|---|
| 1. Visibility Audit | 2 weeks | Pain point, data sources | 50,000–1.5 lakh | Clear pain point |
| 2. Tracking Dashboard | 8 weeks | Live map, trip status | 5–12 lakh | Team uses daily |
| 3. Driver App & Dispatch | 10 weeks | Driver app, dispatch module | 10–22 lakh | Drivers adopt, dispatch faster |
| 4. Route Optimization | 10 weeks | Optimized routes, analytics | 10–25 lakh | Measurable savings |
| 5. Scale & Advanced | 6 months | Full fleet, AI, ERP billing | 15–40 lakh | Measurable improvement |
Risks, Pitfalls, and Governance
The Most Common Logistics Software Failures
GPS data quality. Poor device installation, connectivity gaps, and device failures produce unreliable data. Mitigation: Validate data, flag gaps, and maintain devices.
Driver resistance. Drivers may see tracking as surveillance or resist using an app. Mitigation: Communicate benefits (less paperwork, faster payments, proof of delivery), involve drivers in design, and keep the app simple.
Map inaccuracy for India. Road networks and addresses are inconsistent. Route optimization on bad map data produces bad routes. Mitigation: Test on real routes, use multiple map providers, and allow driver feedback.
Over-engineering route optimization. Advanced optimization before the basics work. Mitigation: Start with tracking and dispatch, add optimization after the data foundation is solid.
No change management. A system that dispatchers and drivers do not use is a failure. Mitigation: Train users, measure adoption, and show benefits.
Risk Summary Table
| Risk | Likelihood | Impact | Mitigation |
|---|---|---|---|
| GPS data quality | High | High (unreliable visibility) | Validate data, maintain devices |
| Driver resistance | High | High (low adoption) | Communicate benefits, simple UX |
| Map inaccuracy | Medium | High (bad routes) | Test, multiple providers, feedback |
| Over-engineering | Medium | High (wasted budget) | Phased approach |
| No change management | High | High (system unused) | Training, adoption metrics |
Benchmark Summary and Decision Framework
Decision Matrix: Build vs Buy
| Factor | Build Custom | Buy TMS/Telematics Platform |
|---|---|---|
| Unique workflow | Complex, company-specific | Standard transport workflow |
| Integration needs | Custom ERP, billing | Standard integrations |
| Cost | Higher upfront, lower per-vehicle | Subscription, per-vehicle pricing |
| Time to market | 8–36 weeks | Weeks |
| Control | Full | Limited to vendor features |
| Best for | Large fleets, unique operations | Mid-sized fleets, standard operations |
Module Priority Table for Indian Logistics
| Pain Point | First Module to Build | Why |
|---|---|---|
| No visibility | Fleet tracking dashboard | Fastest to value, builds data foundation |
| Dispatch delays | Driver app + dispatch module | Direct impact on utilisation |
| High fuel cost | Route optimization | Direct impact on operating cost |
| Customer queries | Customer portal + POD | Direct impact on customer trust |
| Compliance risk | E-way bill integration | Mandatory, reduces risk |
The One-Paragraph Decision Rule
If you do not know where your vehicles are, build fleet tracking first. If dispatch is slow and manual, build the driver app and dispatch module. If fuel costs are high and routes are inefficient, build route optimization after the tracking foundation is solid. Do not start with AI route optimization—start with visibility and dispatch. Involve drivers in design. Test maps on real Indian roads. And measure adoption, not just technical completion.
Frequently Asked Questions
1. How much does logistics software development cost in India?
A fleet tracking dashboard costs ₹5–12 lakh ($6,000–$14,400). A tracking + driver app costs ₹10–22 lakh ($12,000–$26,400). A full dispatch + tracking system costs ₹20–45 lakh ($24,000–$54,000). An enterprise platform with route optimization costs ₹40–90 lakh ($48,000–$1,08,000).
2. Do I need GPS devices or can I use driver smartphones?
Both work. GPS devices are more reliable and do not depend on the driver keeping an app running. Driver smartphones are cheaper for small fleets but depend on driver behaviour. Many fleets use a hybrid.
3. What is the difference between fleet tracking and dispatch management? Fleet tracking shows where vehicles are. Dispatch management assigns loads to vehicles and drivers, and manages the trip lifecycle. Tracking is visibility; dispatch is operations.
4. How does route optimization reduce costs?
By finding shorter routes, reducing distance and fuel, increasing stops per vehicle, and improving on-time performance. For last-mile delivery and distribution, the savings can be substantial.
5. What e-way bill requirements apply to logistics software?
E-way bill generation is mandatory for goods movement above the threshold. The system must generate the e-way bill at dispatch, handle Part B updates for vehicle changes, and validate the e-way bill for the journey duration.
6. Can I integrate FASTag data into my logistics software?
Yes. FASTag transactions can be matched to trips for toll reconciliation and used as a location signal. Integration requires agreements with banks or a third-party aggregator.
7. How does DPDPA affect driver tracking?
Driver location and behaviour data are personal data. Drivers should be informed about what is collected and why. Consent, purpose limitation, access control, and audit logging apply.
8. What maps API should I use for India?
Google Maps, HERE, and Mapbox all have India coverage. Test route quality on real Indian roads before committing. Some providers have better coverage in metros; others in tier-2 cities.
9. How long does it take to implement logistics software?
A fleet tracking dashboard takes 8–12 weeks. A full dispatch system takes 18–28 weeks. An enterprise platform with route optimization takes 24–36 weeks. Timeline depends on integration complexity and fleet size.
10. Should I build or buy a transport management system?
Build if your workflows are unique and integration needs are complex. Buy if your operations are standard and you need to move fast. Many companies start with a bought telematics platform and build the dispatch and integration layers.
11. What are the biggest risks in logistics software development?
GPS data quality, driver resistance, map inaccuracy for India, over-engineering, and no change management. All are preventable with proper planning and phased rollout.
12. How can Innovative AI Solutions help?
Innovative AI Solutions builds logistics software for Indian fleet operators, 3PLs, and transporters—fleet tracking, dispatch management, route optimization, driver apps, e-way bill integration, and DPDPA-compliant data handling. Our Delhi-based team handles architecture, development, and phased rollout. Visit https://innovativeais.com to discuss your requirements.
Contact Innovative AI Solutions
Ready to close the visibility gap in your fleet operations?
[One-line supporting sentence.]
Contact Information
Innovative AI Solutions
📍 Netaji Subhash Place, Pitampura, Delhi – 110034
🌐 Website: https://innovativeaislabs.com 📧 Email: info@innovativeais.com
📞 Phone: +91 7464 099 059 / +91 96899 67356
Business Services
AI Automation
AI Development
AI Consulting
Machine Learning Solutions
Deep Learning Solutions
Generative AI Services
NLP Solutions
AI Agents
AI Chatbots
Voice AI
CRM Development
Custom Software Development
Website Development
Mobile App Development
About the Author
Abhishek Kumar
Founder & CEO, Innovative AI Solutions
5+ years building production AI systems for Indian businesses. Based in Delhi, serving clients across India.
Ready to build AI solutions for your business?
Innovative AI Solutions — Delhi's leading AI development company. Free consultation available.
Get Free Consultation →
A practical 2026 guide for Indian logistics companies building fleet tracking, dispatch and route optimization—architecture, real rupee costs, e-way bill and DPDPA compliance, and a phased rollout that starts with visibility and earns its way to AI.
#LogisticsSoftware #FleetTracking #DispatchManagement #RouteOptimization #TransportManagement #GPS Tracking #Telematics #LastMileDelivery #EWayBill #FASTag #DPDPA #MeitY #AI Routing #LogisticsIndia #FleetManagement #DelhiNCR #InnovativeAISolutions
Copyright ©️ 2015–2026 Innovative AI Solutions. All Rights Reserved. | Privacy Policy | Terms & Conditions