


The 3 A.M. Question: Why Did It Break?
A payment service goes down at 2:47 a.m. The on-call engineer is paged. The dashboard shows a spike in errors and a drop in successful transactions. But the dashboard does not say why. Is it the database? The payment gateway? A bad deployment? A network issue? The engineer spends the next 90 minutes checking logs across four services, comparing metrics from three dashboards, and guessing.
This is the difference between monitoring and observability. Monitoring tells you that something is broken. Observability tells you why. In a modern distributed application—microservices, APIs, third-party integrations, cloud infrastructure—the "why" is rarely in a single dashboard. It is in the relationships between logs, metrics, and traces across services.
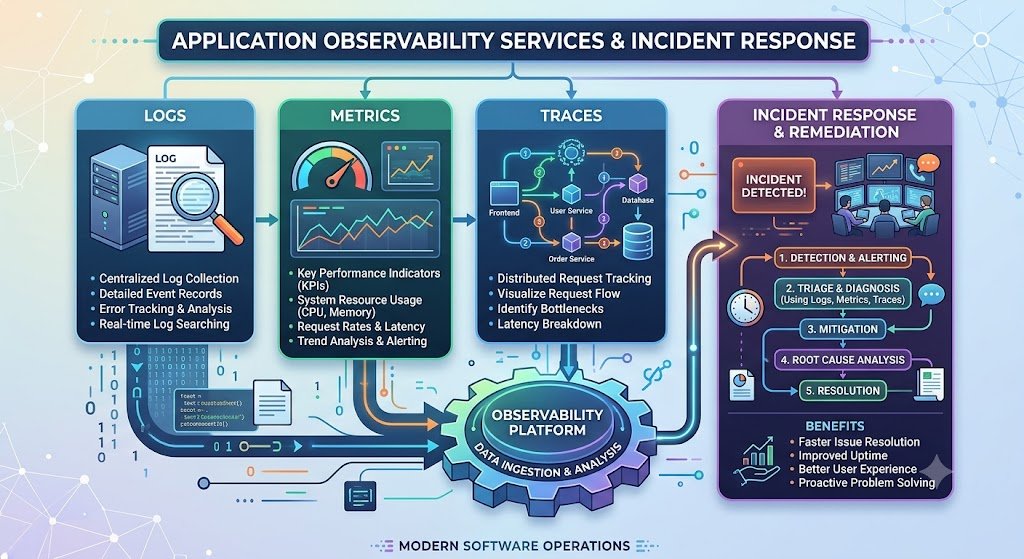
Application observability services are the discipline of building systems that make applications understandable from the outside: collecting the right telemetry (logs, metrics, traces), correlating it across services, alerting on meaningful signals, and enabling fast incident response. It is not a tool purchase. It is an engineering capability that determines how quickly you detect problems, how quickly you resolve them, and how much downtime costs.
The cost of poor observability is measurable. Every minute of downtime in a revenue-generating application is lost revenue. Every hour an engineer spends debugging without the right data is wasted engineering cost. Every incident that recurs because the root cause was never properly identified is a recurring cost. For Indian businesses running customer-facing applications, observability is not a nice-to-have—it is the difference between a minor blip and a major outage.
India adds specific considerations. DPDPA applies to logs that contain personal data—and logs almost always do. Data localisation may require telemetry storage in India for regulated sectors. Cost management matters because observability vendors charge by data volume, and logs can become expensive quickly. And AI-driven observability is changing what is possible—anomaly detection, automated root cause analysis, and AI-assisted incident response are now accessible to mid-sized teams.
This guide is written for Indian CTOs, engineering leaders, SREs, and DevOps teams evaluating observability. We will cover the three pillars (logs, metrics, traces), the incident response process, real costs in rupees and dollars, DPDPA compliance for telemetry, and a phased implementation framework with clear go/no-go gates.
Monitoring vs Observability: The Distinction That Matters
The terms are often used interchangeably, but they describe different capabilities.
Monitoring: Known Unknowns
Monitoring is the practice of collecting predefined metrics and alerting when they cross thresholds. It answers questions you knew to ask in advance: Is CPU usage high? Is error rate elevated? Is latency above threshold?
Monitoring is essential but limited. It can tell you that something is wrong, but not why. It works well for known failure modes and poorly for novel ones.
Observability: Unknown Unknowns
Observability is the ability to understand the internal state of a system from its external outputs. It answers questions you did not know to ask: Why is this specific user's request slow? Which service in this trace is the bottleneck? What changed between the working and failing requests?
Observability requires high-cardinality data—the ability to slice and dice telemetry by user ID, request ID, tenant, region, and any other dimension. It requires correlation—linking a log line to a trace to a metric. And it requires context—enough information to understand what was happening when the problem occurred.
Monitoring vs Observability Table
| Dimension | Monitoring | Observability |
|---|---|---|
| Question | Is something wrong? | Why is it wrong? |
| Data | Predefined metrics | Logs, metrics, traces, high cardinality |
| Failure modes | Known | Known and unknown |
| Alerting | Threshold-based | Anomaly-based, contextual |
| Debugging | Dashboard inspection | Query and correlation |
| Maturity | Baseline | Advanced |
The practical implication: Monitoring is a subset of observability. You need both. But if you only have monitoring, you will spend incidents guessing.
For teams building the applications that observability will monitor, our Custom Software Development and AI Development practices cover the full stack.
The Three Pillars: Logs, Metrics and Traces
Observability is built on three types of telemetry. Each answers different questions, and together they provide a complete picture.
Logs: What Happened
Logs are timestamped records of events. They answer the question: what happened at this specific moment?
Types of logs:
Application logs: errors, warnings, info messages from the application code.
Access logs: HTTP requests, response codes, latency.
Infrastructure logs: system events, container logs, cloud provider logs.
Audit logs: security-relevant events (who accessed what).
Best practices:
Structured logging: JSON format with consistent fields (timestamp, level, service, request ID, user ID).
Correlation IDs: every request gets a unique ID that appears in all logs for that request.
Log levels: debug, info, warn, error, fatal—used consistently.
PII redaction: personal data must be redacted before logging (DPDPA requirement).
Retention: define retention periods based on compliance and cost.
The cost problem: Logs are voluminous and expensive to store. A high-traffic application can generate terabytes of logs per month. Sampling, aggregation, and tiered retention (hot, warm, cold) are essential for cost control.
Metrics: How Much, How Many, How Fast
Metrics are numerical measurements over time. They answer the question: how is the system performing?
Types of metrics:
Counter: cumulative count (requests, errors).
Gauge: current value (CPU usage, memory, queue depth).
Histogram: distribution of values (latency percentiles).
Summary: precomputed quantiles.
Key metrics for applications:
RED metrics: Rate (requests per second), Errors (error rate), Duration (latency).
USE metrics: Utilisation, Saturation, Errors (for infrastructure).
Business metrics: orders per minute, signups, revenue.
Best practices:
Percentiles, not averages: p50, p95, p99 latency is more useful than average.
Labels/tags: attach dimensions (service, endpoint, status code) for slicing.
Cardinality control: high-cardinality labels (user ID) are expensive; use them carefully.
Retention: metrics are cheaper than logs; longer retention is feasible.
Traces: The Journey of a Request
Traces follow a single request as it travels through multiple services. They answer the question: where did the time go, and where did it fail?
How traces work:
A request enters the system and is assigned a trace ID.
Each service that handles the request creates a span with its own span ID, start time, duration, and metadata.
Spans are linked to form a trace—a tree of all the work done for that request.
What traces reveal:
Which service is the bottleneck.
Which database query is slow.
Where an error originated.
How a request flows through the system.
Best practices:
Instrument all services: every service should emit spans.
Propagate context: trace IDs must be passed between services.
Sample strategically: not every request needs to be traced; sample errors and slow requests at higher rates.
Use OpenTelemetry: the standard for instrumentation, vendor-neutral.
Three Pillars Comparison Table
| Pillar | Question | Data Type | Cost | Retention |
|---|---|---|---|---|
| Logs | What happened? | Text events | High (volume) | Days to months |
| Metrics | How is it performing? | Numbers over time | Low-Medium | Months to years |
| Traces | Where did time go? | Request spans | Medium | Days to weeks |
Incident Response: From Alert to Resolution
Observability exists to support incident response. The quality of the response determines the business impact of an incident.
The Incident Response Lifecycle
1. Detection. An alert fires, or a user reports a problem. The faster the detection, the smaller the impact.
2. Triage. The on-call engineer assesses severity, identifies the affected systems, and decides whether to escalate.
3. Diagnosis. Using logs, metrics, and traces, the engineer identifies the root cause.
4. Mitigation. The immediate fix—rollback, failover, scaling, or hotfix—to restore service.
5. Resolution. The permanent fix.
6. Post-mortem. A blameless review of what happened, why, and what to change.
The Role of Observability in Each Stage
| Stage | Observability Role |
|---|---|
| Detection | Alerting on meaningful signals, anomaly detection |
| Triage | Dashboards showing scope and severity |
| Diagnosis | Logs, traces, and correlation to find root cause |
| Mitigation | Confirming the fix worked |
| Resolution | Verifying stability |
| Post-mortem | Historical data for analysis |
Alerting Best Practices
Alert on symptoms, not causes. Alert on high error rate or latency, not on high CPU (which may be normal). Symptoms reflect user impact.
Use SLOs and error budgets. Define Service Level Objectives (e.g., 99.9% availability). Alert when the error budget is being consumed too fast.
Reduce alert fatigue. Too many alerts cause engineers to ignore them. Tune thresholds, use anomaly detection, and route alerts to the right team.
Include context in alerts. An alert should include: what is wrong, which service, since when, and a link to the relevant dashboard or runbook.
SLOs and Error Budgets
A Service Level Indicator (SLI) is a measurement of service health (e.g., percentage of successful requests). A Service Level Objective (SLO) is a target for the SLI (e.g., 99.9% success rate). An error budget is the allowed amount of failure (0.1% of requests).
SLOs and error budgets shift the conversation from "is the system up?" to "how much reliability can we afford?" They balance reliability investment against feature velocity.
Incident Response Table
| Severity | Definition | Response |
|---|---|---|
| SEV-1 | Complete outage, revenue impact | Immediate, all hands |
| SEV-2 | Major degradation, some users affected | Immediate, on-call |
| SEV-3 | Minor degradation, workaround available | Next business day |
| SEV-4 | Cosmetic, no user impact | Backlog |
Real Costs in India (2026)
Observability costs have two components: tooling and people. Tooling costs scale with data volume, and people costs depend on the maturity of the practice.
Tooling Costs
| Category | Monthly Cost (₹) | Monthly Cost ($ approx.) | Notes |
|---|---|---|---|
| Open-source self-hosted (Prometheus, Grafana, Loki, Jaeger) | ₹20,000–₹1,00,000 | $240–$1,200 | Infrastructure + engineering time |
| Managed SaaS (mid-tier) | ₹40,000–₹2,00,000 | $480–$2,400 | Depends on data volume |
| Enterprise platforms (Datadog, New Relic, Dynatrace) | ₹1,50,000–₹10,00,000+ | $1,800–$12,000+ | Per-host or per-data pricing |
| Incident management (PagerDuty, Opsgenie) | ₹10,000–₹50,000 | $120–$600 | Per-user pricing |
The Data Volume Problem
Observability vendors charge by data volume—ingested logs, metrics series, traces. A high-traffic application can generate costs that grow faster than revenue.
Cost control strategies:
Sampling: trace a percentage of requests, not all.
Tiered retention: hot storage for recent data, cold storage for older data.
Log aggregation: aggregate before storing, keep raw logs only for errors.
Cardinality control: limit high-cardinality labels in metrics.
Drop noise: filter out health checks, debug logs, and low-value data.
People Costs
| Role | Monthly Cost (₹) | Monthly Cost ($ approx.) |
|---|---|---|
| SRE/Platform engineer | ₹1–3 lakh | $1,200–$3,600 |
| DevOps engineer | ₹80,000–₹2 lakh | $960–$2,400 |
| On-call rotation | Included in SRE role | — |
For most Indian mid-sized companies, a team of 1–2 SREs plus the tooling costs is the realistic investment.
Implementation Costs
| Scope | Cost (₹) | Cost ($ approx.) | Timeline |
|---|---|---|---|
| Basic observability (metrics + logs + basic alerting) | ₹3–8 lakh | $3,600–$9,600 | 4–8 weeks |
| Intermediate (add traces, dashboards, SLOs) | ₹8–20 lakh | $9,600–$24,000 | 8–16 weeks |
| Advanced (full OpenTelemetry, incident management, AI-assisted) | ₹20–50 lakh | $24,000–$60,000 | 16–24 weeks |
Total Cost of Ownership
For a mid-sized Indian company with 20 services and moderate traffic:
Tooling: ₹1–3 lakh/month ($1,200–$3,600)
People: ₹1–3 lakh/month ($1,200–$3,600)
Annual total: ₹24–72 lakh ($28,800–$86,400)
This is significant, but so is the cost of downtime. A single hour of outage in a revenue-generating application can exceed a month of observability costs.
India-Specific Compliance: DPDPA, Data Localisation and MeitY
DPDPA: Logs Contain Personal Data
Logs almost always contain personal data: IP addresses, user IDs, request payloads, error messages with user information. Under the DPDP Act, this data is subject to:
Purpose limitation: logs collected for debugging should not be used for other purposes.
Data minimisation: log only what is necessary.
PII redaction: personal data should be redacted before storage where possible.
Retention: define retention periods and purge data when no longer needed.
Breach notification: if logs are breached, notification obligations apply.
Data Localisation
For regulated sectors (BFSI, healthcare), data localisation may require telemetry storage in India. Observability vendors with Indian regions (AWS, Azure, GCP) or self-hosted solutions meet this requirement.
MeitY AI Governance
If observability uses AI (anomaly detection, root cause analysis), MeitY's guidelines apply. Transparency about AI-driven alerts and human oversight for critical decisions.
Compliance Checklist
| Requirement | Implementation | Priority |
|---|---|---|
| PII redaction in logs | Redact before storage | High |
| Data minimisation | Log only necessary fields | Medium |
| Retention policy | Define and enforce | High |
| Data localisation | Indian region storage | Medium (regulated sectors) |
| Access control | Role-based access to telemetry | High |
| Breach response | Incident response plan | High |
Implementation Framework: A Phased Approach With Cost Gates
Phase 1: Assessment and Strategy (Week 1–2)
Objective: Understand the current state and define the observability strategy.
Activities:
Inventory services, infrastructure, and current monitoring.
Identify gaps: what questions can you not answer today?
Define SLOs for critical services.
Choose tooling: open-source vs managed vs enterprise.
Assess DPDPA exposure in logs.
Cost: ₹50,000–₹1.5 lakh ($600–$1,800).
Go/No-Go: Strategy defined. Tooling chosen. SLOs identified.
Phase 2: Metrics and Alerting (Week 3–6)
Objective: Establish baseline metrics and meaningful alerting.
Activities:
Instrument services with metrics (RED/USE).
Set up dashboards.
Configure alerting on symptoms.
Define on-call rotation.
Cost: ₹2–5 lakh ($2,400–$6,000).
Go/No-Go: Metrics available. Alerts fire correctly. On-call defined.
Phase 3: Logs and Correlation (Week 7–12)
Objective: Add structured logging with correlation.
Activities:
Implement structured logging.
Add correlation IDs.
Implement PII redaction.
Set up log aggregation and retention.
Link logs to traces.
Cost: ₹3–8 lakh ($3,600–$9,600).
Go/No-Go: Logs searchable. Correlation works. PII redacted.
Phase 4: Tracing and Distributed Context (Week 13–20)
Objective: Add distributed tracing.
Activities:
Instrument services with OpenTelemetry.
Propagate trace context.
Set up trace storage and sampling.
Build trace-based debugging workflows.
Cost: ₹5–12 lakh ($6,000–$14,400).
Go/No-Go: Traces show request flow. Bottlenecks identifiable.
Phase 5: Incident Management and SLOs (Week 21–28)
Objective: Formalise incident response and SLO management.
Activities:
Incident management tooling (PagerDuty, Opsgenie).
Runbooks for common incidents.
Post-mortem process.
SLO dashboards and error budget tracking.
Cost: ₹3–10 lakh ($3,600–$12,000).
Go/No-Go: Incident response works. Post-mortems happen. SLOs tracked.
Phase Summary Table
| Phase | Duration | Key Deliverable | Cost (₹) | Go/No-Go Criteria |
|---|---|---|---|---|
| 1. Assessment | 2 weeks | Strategy, tooling, SLOs | 50,000–1.5 lakh | Strategy defined |
| 2. Metrics & Alerting | 4 weeks | Metrics, dashboards, alerts | 2–5 lakh | Alerts work |
| 3. Logs & Correlation | 6 weeks | Structured logs, PII redaction | 3–8 lakh | Logs searchable |
| 4. Tracing | 8 weeks | Distributed traces | 5–12 lakh | Bottlenecks visible |
| 5. Incident Management | 8 weeks | Runbooks, post-mortems, SLOs | 3–10 lakh | Incidents managed |
Risks, Pitfalls, and Governance
The Most Common Observability Failures
Alert fatigue. Too many alerts cause engineers to ignore them. Mitigation: Alert on symptoms, tune thresholds, use anomaly detection.
Cost explosion. Log volume grows faster than revenue. Mitigation: Sampling, tiered retention, aggregation, noise filtering.
PII in logs. Logs contain personal data without redaction. Mitigation: Redact PII before storage.
No correlation. Logs, metrics, and traces are disconnected. Mitigation: Correlation IDs, OpenTelemetry, unified platform.
Tool sprawl. Multiple tools with no integration. Mitigation: Standardise on OpenTelemetry, consolidate tools.
No post-mortems. Incidents recur because root causes are not fixed. Mitigation: Blameless post-mortem process.
Risk Summary Table
| Risk | Likelihood | Impact | Mitigation |
|---|---|---|---|
| Alert fatigue | High | High | Symptom-based alerts, tuning |
| Cost explosion | High | Medium | Sampling, retention, aggregation |
| PII in logs | Medium | Critical | PII redaction |
| No correlation | High | High | Correlation IDs, OpenTelemetry |
| Tool sprawl | Medium | Medium | Standardise, consolidate |
| No post-mortems | High | Medium | Blameless process |
Benchmark Summary and Decision Framework
Decision Matrix: Open-Source vs Managed vs Enterprise
| Factor | Open-Source Self-Hosted | Managed SaaS | Enterprise Platform |
|---|---|---|---|
| Cost | Lowest tooling, highest engineering | Medium | Highest |
| Setup effort | High | Low | Low |
| Control | Full | Medium | Medium |
| Scalability | Depends on team | High | High |
| Best for | Teams with platform engineers | Most mid-sized companies | Large enterprises |
Observability Maturity Table
| Level | Characteristics | Typical State |
|---|---|---|
| Level 0: None | No monitoring, reactive | Early startups |
| Level 1: Monitoring | Metrics, basic alerts | Most companies |
| Level 2: Logs | Structured logs, correlation | Growing companies |
| Level 3: Traces | Distributed tracing, SLOs | Mature engineering |
| Level 4: AI-assisted | Anomaly detection, automated RCA | Leading companies |
The One-Paragraph Decision Rule
If you are starting from scratch, begin with metrics and alerting—they give the fastest value. Add structured logs with correlation IDs next. Add distributed tracing when you have multiple services. Formalise incident response and SLOs when the team is ready. Standardise on OpenTelemetry to avoid tool lock-in. Redact PII from logs from day one. And control costs with sampling and retention policies before the bill surprises you.
Frequently Asked Questions
1. What is the difference between monitoring and observability?
Monitoring tells you that something is wrong (predefined metrics and alerts). Observability tells you why (logs, metrics, traces, high cardinality, correlation). Monitoring is a subset of observability.
2. What are the three pillars of observability?
Logs (what happened), metrics (how is it performing), and traces (where did time go). Together they provide a complete picture of application health.
3. How much does application observability cost in India?
Basic observability costs ₹3–8 lakh ($3,600–$9,600) to implement. Managed SaaS tooling costs ₹40,000–₹2,00,000/month ($480–$2,400). Enterprise platforms cost ₹1.5–10 lakh/month ($1,800–$12,000). People costs add ₹1–3 lakh/month for SREs.
4. Should I use open-source or managed observability tools?
Open-source (Prometheus, Grafana, Loki, Jaeger) has lower tooling cost but requires engineering effort. Managed SaaS is faster to set up and scales better. Most mid-sized companies choose managed; teams with platform engineers choose open-source.
5. What is OpenTelemetry and why does it matter?
OpenTelemetry is a vendor-neutral standard for instrumentation. It lets you collect logs, metrics, and traces without locking into a specific vendor, and switch backends without re-instrumenting.
6. How do I reduce observability costs?
Sampling (trace a percentage of requests), tiered retention (hot/warm/cold), log aggregation, cardinality control, and filtering out noise (health checks, debug logs).
7. How does DPDPA affect observability?
Logs often contain personal data. PII must be redacted, retention policies defined, access controlled, and data localisation considered for regulated sectors.
8. What are SLOs and error budgets?
SLOs (Service Level Objectives) are targets for service health (e.g., 99.9% availability). Error budgets are the allowed amount of failure. They balance reliability against feature velocity.
9. How do I avoid alert fatigue?
Alert on symptoms (error rate, latency) not causes (CPU). Tune thresholds. Use anomaly detection. Route alerts to the right team. Review alerts regularly.
10. What is distributed tracing?
Tracing follows a single request through multiple services, showing where time was spent and where failures occurred. It requires trace IDs propagated between services.
11. How long should I retain logs and traces?
Logs: 7–30 days hot, longer in cold storage if compliance requires. Traces: 3–7 days with sampling. Metrics: months to years.
12. How can Innovative AI Solutions help?
Innovative AI Solutions builds observability capabilities for Indian engineering teams—OpenTelemetry instrumentation, dashboards, alerting, incident response, and DPDPA-compliant log management. Our Delhi-based team handles assessment, implementation, and ongoing support. Visit https://innovativeais.com to discuss your requirements.
Contact Innovative AI Solutions
Ready to know why your application broke—not just that it broke?
[One-line supporting sentence.]
Contact Information
Innovative AI Solutions
📍 Netaji Subhash Place, Pitampura, Delhi – 110034
🌐 Website: https://innovativeaislabs.com 📧 Email: info@innovativeais.com
📞 Phone: +91 7464 099 059 / +91 96899 67356
Business Services
AI Automation
AI Development
AI Consulting
Machine Learning Solutions
Deep Learning Solutions
Generative AI Services
NLP Solutions
AI Agents
AI Chatbots
Voice AI
CRM Development
Custom Software Development
Website Development
Mobile App Development
About the Author
Abhishek Kumar
Founder & CEO, Innovative AI Solutions
5+ years building production AI systems for Indian businesses. Based in Delhi, serving clients across India.
Ready to build AI solutions for your business?
Innovative AI Solutions — Delhi's leading AI development company. Free consultation available.
Get Free Consultation →
Final Tagline
A practical 2026 guide for Indian engineering teams building observability—logs, metrics and traces, incident response, real rupee costs, DPDPA-compliant telemetry, and a phased rollout that starts with metrics and earns its way to distributed tracing.
Hashtags: #Observability #ApplicationObservability #LogsMetricsTraces #APM #DistributedTracing #IncidentResponse #SRE #OpenTelemetry #SLO #Alerting #DPDPA #MeitY #DevOps #ObservabilityIndia #DelhiNCR #InnovativeAISolutions
Copyright ©️ 2015–2026 Innovative AI Solutions. All Rights Reserved. | Privacy Policy | Terms & Conditions