


Why Developer Salaries Vary So Much
Software development is a global profession. A developer in Bangalore and a developer in San Francisco may work on the same technology stack, solve the same problems, and produce comparable output. Yet their salaries can differ by 10x or more.
This variation is driven by market conditions, not by skill differences. High-income countries have higher costs of living, higher employer contributions, stronger currencies, and more competition for talent. Lower-income countries have lower costs, weaker currencies, and larger talent pools relative to demand.
For developers, this creates a choice: higher salary in a high-cost country, or lower salary with higher purchasing power in a lower-cost country. For companies, it creates an opportunity: access global talent at different price points.
This guide compares software developer salaries by country in 2026. It covers gross salary, take-home pay, purchasing power, and remote work considerations.
For companies building software cost-effectively, Innovative AI Solutions provides custom software development and AI development services.
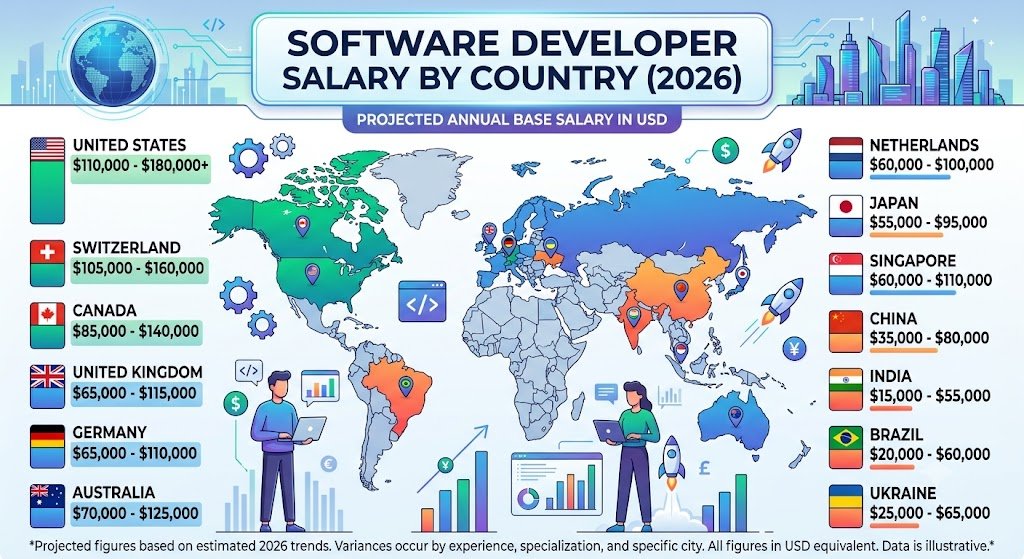
Global Salary Comparison (2026)
Gross Annual Salary by Country (Mid-Level Developer)
| Country | Salary Range (USD) | Salary Range (INR) |
|---|---|---|
| Switzerland | $110,000–$160,000 | ₹88,00,000–₹1,28,00,000 |
| United States | $100,000–$180,000 | ₹80,00,000–₹1,44,00,000 |
| Australia | $85,000–$130,000 | ₹68,00,000–₹1,04,00,000 |
| Canada | $80,000–$130,000 | ₹64,00,000–₹1,04,00,000 |
| Germany | $75,000–$120,000 | ₹60,00,000–₹96,00,000 |
| United Kingdom | $70,000–$130,000 | ₹56,00,000–₹1,04,00,000 |
| Netherlands | $70,000–$110,000 | ₹56,00,000–₹88,00,000 |
| Singapore | $65,000–$110,000 | ₹52,00,000–₹88,00,000 |
| UAE | $55,000–$95,000 | ₹44,00,000–₹76,00,000 |
| Poland | $35,000–$65,000 | ₹28,00,000–₹52,00,000 |
| India | $12,000–$35,000 | ₹10,00,000–₹28,00,000 |
Senior Developer Salary by Country
| Country | Salary Range (USD) | Salary Range (INR) |
|---|---|---|
| Switzerland | $160,000–$220,000 | ₹1,28,00,000–₹1,76,00,000 |
| United States | $150,000–$300,000 | ₹1,20,00,000–₹2,40,00,000 |
| Australia | $120,000–$180,000 | ₹96,00,000–₹1,44,00,000 |
| Canada | $120,000–$180,000 | ₹96,00,000–₹1,44,00,000 |
| Germany | $110,000–$170,000 | ₹88,00,000–₹1,36,00,000 |
| United Kingdom | $110,000–$180,000 | ₹88,00,000–₹1,44,00,000 |
| Netherlands | $100,000–$150,000 | ₹80,00,000–₹1,20,00,000 |
| Singapore | $95,000–$160,000 | ₹76,00,000–₹1,28,00,000 |
| UAE | $80,000–$140,000 | ₹64,00,000–₹1,12,00,000 |
| Poland | $55,000–$95,000 | ₹44,00,000–₹76,00,000 |
| India | $25,000–$70,000 | ₹20,00,000–₹56,00,000 |
India: Salary by Experience Level
| Level | Experience | Salary Range (INR/year) | Salary Range (USD/year) |
|---|---|---|---|
| Fresher | 0–1 years | ₹3,00,000–₹8,00,000 | $3,600–$9,600 |
| Junior | 1–3 years | ₹6,00,000–₹15,00,000 | $7,200–$18,000 |
| Mid-level | 3–6 years | ₹12,00,000–₹30,00,000 | $14,400–$36,000 |
| Senior | 6–10 years | ₹25,00,000–₹60,00,000 | $30,000–$72,000 |
| Lead / Architect | 10+ years | ₹40,00,000–₹1,00,00,000+ | $48,000–$1,20,000+ |
India: Salary by City
| City | Mid-Level (INR/year) | Senior (INR/year) |
|---|---|---|
| Bangalore | ₹15,00,000–₹35,00,000 | ₹30,00,000–₹70,00,000 |
| Delhi NCR | ₹12,00,000–₹28,00,000 | ₹25,00,000–₹60,00,000 |
| Mumbai | ₹13,00,000–₹30,00,000 | ₹28,00,000–₹65,00,000 |
| Hyderabad | ₹12,00,000–₹28,00,000 | ₹25,00,000–₹60,00,000 |
| Pune | ₹11,00,000–₹25,00,000 | ₹22,00,000–₹55,00,000 |
Take-Home Pay vs Gross Salary
Tax Rates by Country
| Country | Top Tax Rate | Effective Tax (Mid-Level) |
|---|---|---|
| Switzerland | 40% | 20–30% |
| United States | 37% | 25–35% |
| Germany | 45% | 35–45% |
| United Kingdom | 45% | 30–40% |
| Netherlands | 49.5% | 35–45% |
| Canada | 53% | 30–40% |
| Australia | 45% | 30–40% |
| India | 30% | 15–30% |
Take-Home Comparison (Mid-Level Developer)
| Country | Gross (USD) | Take-Home (USD) | Take-Home % |
|---|---|---|---|
| Switzerland | $135,000 | $100,000 | 74% |
| United States | $140,000 | $100,000 | 71% |
| UAE | $75,000 | $75,000 | 100% |
| United Kingdom | $100,000 | $67,000 | 67% |
| Canada | $105,000 | $71,000 | 68% |
| Australia | $107,000 | $71,000 | 66% |
| Germany | $97,000 | $58,000 | 60% |
| Netherlands | $90,000 | $54,000 | 60% |
| Poland | $50,000 | $36,000 | 72% |
| India | $20,000 | $16,000 | 80% |
The UAE has no income tax, which significantly boosts take-home pay. India has lower tax rates at mid-level salaries.
Purchasing Power Comparison
Cost of Living Index
| Country | Cost of Living Index (US = 100) |
|---|---|
| Switzerland | 130 |
| United States | 100 |
| Australia | 85 |
| Canada | 80 |
| Netherlands | 85 |
| United Kingdom | 85 |
| Germany | 75 |
| UAE | 70 |
| Poland | 45 |
| India | 25 |
Purchasing Power Adjusted Salary
| Country | Gross (USD) | Adjusted for Cost of Living (USD) |
|---|---|---|
| Switzerland | $135,000 | $104,000 |
| United States | $140,000 | $140,000 |
| UAE | $75,000 | $107,000 |
| Australia | $107,000 | $126,000 |
| Canada | $105,000 | $131,000 |
| Germany | $97,000 | $129,000 |
| Netherlands | $90,000 | $106,000 |
| United Kingdom | $100,000 | $118,000 |
| Poland | $50,000 | $111,000 |
| India | $20,000 | $80,000 |
When adjusted for cost of living, the differences narrow significantly. A developer in India earning $20,000 has purchasing power equivalent to $80,000 in the US. A developer in Poland earning $50,000 has purchasing power equivalent to $111,000.
Remote Work and Global Salaries
The Remote Work Premium
Remote work has changed salary dynamics. Developers in lower-cost countries can earn higher salaries working for companies in higher-cost countries.
| Model | Salary Range (USD) |
|---|---|
| Local company, local salary | Local market rate |
| Remote for foreign company | 40–100% premium |
| Remote for US company | 2–4x local rate |
Remote Salary Benchmarks
| Developer Location | Local Salary (USD) | Remote for US (USD) |
|---|---|---|
| India | $12,000–$35,000 | $30,000–$80,000 |
| Poland | $35,000–$65,000 | $60,000–$120,000 |
| Latin America | $25,000–$60,000 | $60,000–$130,000 |
| Eastern Europe | $30,000–$70,000 | $60,000–$130,000 |
Remote work allows developers in lower-cost countries to earn significantly more than local market rates while companies save compared to hiring locally.
The Company Perspective
| Hiring Model | Cost (USD/year) | Quality |
|---|---|---|
| US in-house | $180,000–$300,000 | High |
| US remote | $150,000–$250,000 | High |
| Nearshore remote | $60,000–$120,000 | High |
| Offshore remote | $25,000–$70,000 | High (with vetting) |
Companies can access high-quality developers at 60–80% lower cost by hiring remotely in lower-cost countries.
Salary by Specialisation
Premium Specialisations
| Specialisation | Premium vs Generalist |
|---|---|
| AI/ML Engineer | 20–40% |
| Security Engineer | 15–30% |
| DevOps/SRE | 15–25% |
| Data Engineer | 10–20% |
| Blockchain Developer | 10–30% |
| Mobile (iOS/Android) | 5–15% |
AI/ML Salary Premium
| Country | Generalist (USD) | AI/ML (USD) | Premium |
|---|---|---|---|
| United States | $140,000 | $180,000–$350,000 | 30–150% |
| Germany | $97,000 | $120,000–$180,000 | 25–85% |
| United Kingdom | $100,000 | $130,000–$200,000 | 30–100% |
| India | $20,000 | $30,000–$70,000 | 50–250% |
AI/ML specialists command significant premiums globally, reflecting demand.
India-Specific Considerations
Why Indian Salaries Are Lower
| Factor | Impact |
|---|---|
| Cost of living | Lower |
| Currency | Weaker rupee |
| Talent supply | Large pool |
| Market maturity | Developing |
| Competition | High among developers |
Why Indian Developers Are Competitive
| Factor | Advantage |
|---|---|
| English proficiency | High |
| Technical skills | Strong |
| Cost efficiency | 75–85% below US |
| Work ethic | Strong |
| Adaptability | High |
The Indian Salary Trajectory
| Year | Mid-Level (INR/year) |
|---|---|
| 2020 | ₹8,00,000–₹18,00,000 |
| 2023 | ₹10,00,000–₹25,00,000 |
| 2026 | ₹12,00,000–₹30,00,000 |
| Projected 2029 | ₹15,00,000–₹38,00,000 |
Indian developer salaries are rising but remain significantly below Western levels.
Remote Work Impact on Indian Salaries
| Trend | Impact |
|---|---|
| Global remote hiring | Upward pressure on salaries |
| US companies hiring in India | Premium salaries |
| Competition for talent | Salary increases |
| Retention challenges | Higher pay required |
Decision Framework: Salary Comparison
For Developers
| Your Priority | Best Countries |
|---|---|
| Highest gross salary | Switzerland, USA |
| Highest take-home | UAE, Switzerland |
| Best purchasing power | USA, Canada, Germany |
| Career growth | USA, UK, Germany |
| Work-life balance | Netherlands, Germany, Canada |
| Remote opportunities | Any (with remote work) |
For Companies
| Your Priority | Best Locations |
|---|---|
| Lowest cost | India, Poland |
| Time zone (US) | Latin America |
| Time zone (Europe) | Eastern Europe, India |
| Talent depth | India, USA |
| English proficiency | India, Netherlands |
| Quality | Any (with vetting) |
Salary Comparison Scorecard
| Country | Gross | Take-Home | Purchasing Power | Remote Potential |
|---|---|---|---|---|
| Switzerland | Highest | High | Moderate | Low |
| USA | Very High | High | Highest | Moderate |
| UAE | Moderate | Highest | High | Low |
| Germany | High | Moderate | High | Moderate |
| UK | High | Moderate | High | Moderate |
| Canada | High | Moderate | High | Moderate |
| Australia | High | Moderate | High | Moderate |
| Poland | Moderate | Moderate | High | High |
| India | Low | Moderate | Moderate | Highest |
Frequently Asked Questions
1. Which country pays software developers the most?
Switzerland and the United States pay the most in gross salary. Switzerland: $110,000–$220,000. USA: $100,000–$300,000.
2. Which country has the highest take-home pay for developers?
The UAE has the highest take-home pay because there is no income tax. Switzerland and the USA also have high take-home pay after tax.
3. What is the average software developer salary in India in 2026?
Mid-level developers earn ₹12,00,000–₹30,00,000 ($14,400–$36,000). Senior developers earn ₹25,00,000–₹60,00,000 ($30,000–$72,000).
4. How much do software developers earn in the USA?
Mid-level: $100,000–$180,000. Senior: $150,000–$300,000. AI/ML specialists: $180,000–$350,000.
5. Which country has the best purchasing power for developers?
Adjusted for cost of living, the USA, Canada, and Germany offer the best purchasing power. India and Poland offer surprisingly good purchasing power relative to gross salary.
6. How much can Indian developers earn working remotely for US companies?
Indian developers working remotely for US companies earn $30,000–$80,000 — 2–4x local market rates.
7. Which specialisation pays the most?
AI/ML engineering commands the highest premium — 30–150% above generalist salaries depending on country.
8. Why are Indian developer salaries lower than US salaries?
Lower cost of living, weaker currency, larger talent supply relative to demand, and developing market maturity.
9. Will remote work increase Indian developer salaries?
Yes. Global remote hiring creates upward pressure on Indian salaries. Premiums of 2–4x local rates are common for remote work with foreign companies.
10. Which country is best for developer work-life balance?
Netherlands, Germany, and Canada consistently rank highest for work-life balance. USA ranks lower despite higher salaries.
11. How do taxes affect developer salaries?
Tax rates vary from 0% (UAE) to 45%+ (Germany, UK). Take-home pay varies significantly even when gross salaries are similar.
12. How can Innovative AI Solutions help?
Innovative AI Solutions is a Delhi-based software development company that works with international clients. We provide dedicated teams at Indian rates, maintaining quality standards. Explore our custom software development and AI development services.
Contact Innovative AI Solutions
Building a software team or reducing development costs?
We help companies access Indian developer talent at competitive rates with quality safeguards.
Contact Information
Innovative AI Solutions
📍 Netaji Subhash Place, Pitampura, Delhi – 110034
🌐 Website: https://innovativeais.com 📧 Email: info@innovativeais.com
📞 Phone: +91 7464 099 059 / +91 96899 67356
Business Services
• AI Automation • AI Development • AI Consulting • Machine Learning Solutions • Deep Learning Solutions • Generative AI Services • NLP Solutions • AI Agents • AI Chatbots • Voice AI • CRM Development • Custom Software Development • Website Development • Mobile App Development
About the Author
Abhishek Kumar
Founder & CEO, Innovative AI Solutions
5+ years building production AI systems for Indian businesses and international clients. Based in Delhi, serving clients across India and globally.
Ready to build AI solutions for your business?
Innovative AI Solutions — Delhi's leading AI development company. Free consultation available.
Get Free Consultation →
A complete 2026 comparison of software developer salaries by country — gross pay, take-home, purchasing power, and remote work potential in USD and INR.
#SoftwareDeveloperSalary #Country #2026 #GlobalComparison #USA #India #Germany #UK #Canada #Australia #Netherlands #Poland #Singapore #UAE #Switzerland #SalaryGuide #DeveloperPay #SoftwareEngineer #TechSalaries #RemoteWork #PurchasingPower #Taxes #CostOfLiving #TechCareers #InnovativeAISolutions
Copyright © 2015–2026 Innovative AI Solutions. All Rights Reserved. | Privacy Policy | Terms & Conditions